2,353
Views
28
CrossRef citations to date
0
Altmetric
EXTRA VIEW

Exploring chromatin organization mechanisms through its dynamic properties

, , , , , & show all
Pages 27-33 | Received 14 Oct 2015, Accepted 01 Nov 2015, Published online: 01 Mar 2016

Figures & data

Figure 1. Normal and anomalous diffusion. Typical areas covered by 2 telomeres that undergo normal diffusion (A) and anomalous diffusion (B) over 50 time-points acquired during 925 seconds. (C, D) Trajectories of telomeres (green spots) and Cajal bodies (red spots) acquired from time-lapse fluorescence live-cell imaging over 925 seconds in Lmna−/− (C) and Lmna+/+ (D) cells. Note that the volume of movement in the Lmna−/− cells is much larger compared to that in Lmna+/+cells. Scale bar, 3µm.
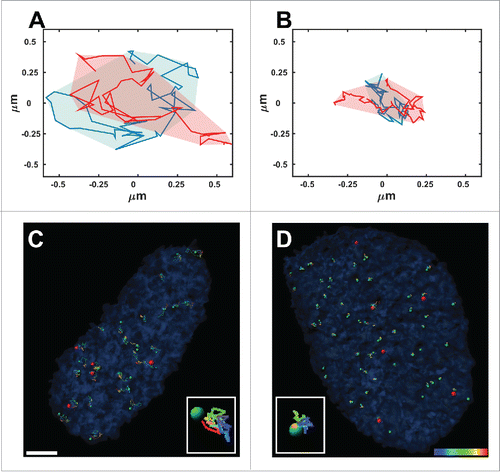
Figure 1. Normal and anomalous diffusion. Typical areas covered by 2 telomeres that undergo normal diffusion (A) and anomalous diffusion (B) over 50 time-points acquired during 925 seconds. (C, D) Trajectories of telomeres (green spots) and Cajal bodies (red spots) acquired from time-lapse fluorescence live-cell imaging over 925 seconds in Lmna−/− (C) and Lmna+/+ (D) cells. Note that the volume of movement in the Lmna−/− cells is much larger compared to that in Lmna+/+cells. Scale bar, 3µm.

Figure 2. Diffusion patterns of telomeres in different cell types. (A) MSD/Δt vs Δt plot in log-log scale for different cell lines. (B) The distribution of α coefficient obtained from single telomeres trajectories (n=325, 166, 551, 958 for the 3T3, HeLa, MF, U2OS cell-lines respectively). (C) MSD/Δt vs Δt plot for Lmna+/+and Lmna−/− cells. (D) Box plot for the α coefficients distribution (n=223, 525 for the Lmna+/+ and Lmna−/− cells respectively). Note the significant difference showing anomalous diffusion in Lmna+/+ and normal diffusion in Lmna−/− cells.
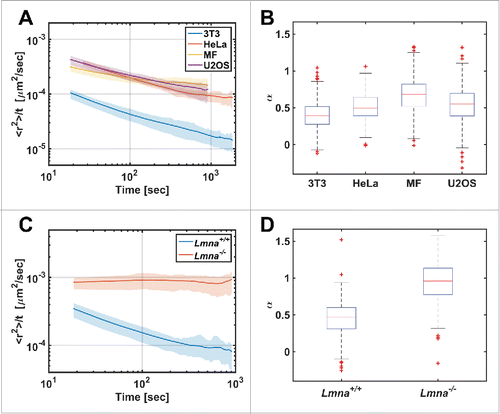
Figure 2. Diffusion patterns of telomeres in different cell types. (A) MSD/Δt vs Δt plot in log-log scale for different cell lines. (B) The distribution of α coefficient obtained from single telomeres trajectories (n=325, 166, 551, 958 for the 3T3, HeLa, MF, U2OS cell-lines respectively). (C) MSD/Δt vs Δt plot for Lmna+/+and Lmna−/− cells. (D) Box plot for the α coefficients distribution (n=223, 525 for the Lmna+/+ and Lmna−/− cells respectively). Note the significant difference showing anomalous diffusion in Lmna+/+ and normal diffusion in Lmna−/− cells.

Figure 3. Comparison of the ratio of volumes of motions for telomeres, Cajal and PML bodies during 925 seconds in Lmna+/+ and Lmna−/− cells. For Lmna+/+ cells n=691, 74, 78 for telomeres, Cajal bodies and PML bodies, respectively. For Lmna−/− cells n=519, 109, 76 for telomeres, Cajal bodies and PML bodies, respectively. All entities explore smaller volumes in the Lmna+/+ compared to the Lmna−/− cells. The effect of lamin A depletion is more significant on chromatin dynamics (telomeres) compared to nuclear bodies.
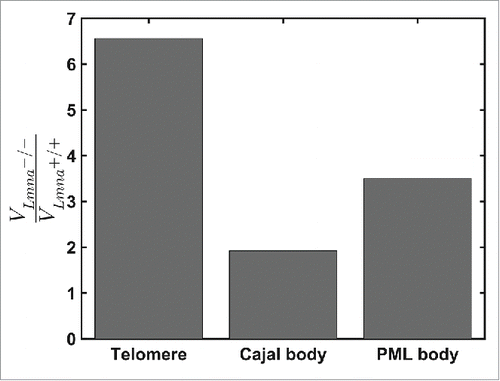
Figure 3. Comparison of the ratio of volumes of motions for telomeres, Cajal and PML bodies during 925 seconds in Lmna+/+ and Lmna−/− cells. For Lmna+/+ cells n=691, 74, 78 for telomeres, Cajal bodies and PML bodies, respectively. For Lmna−/− cells n=519, 109, 76 for telomeres, Cajal bodies and PML bodies, respectively. All entities explore smaller volumes in the Lmna+/+ compared to the Lmna−/− cells. The effect of lamin A depletion is more significant on chromatin dynamics (telomeres) compared to nuclear bodies.
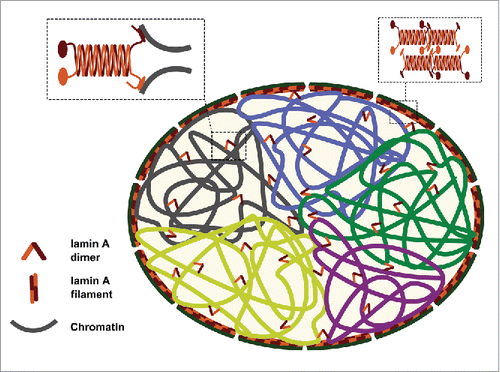
Figure 4. Suggested model explaining the role of lamin A in maintaining the intra-nuclear chromosomal structure. Lamin A serves as a “stapler” that connects adjacent chromosomal regions and helps in keeping chromosome territory structure in place during interphase.

Figure 4. Suggested model explaining the role of lamin A in maintaining the intra-nuclear chromosomal structure. Lamin A serves as a “stapler” that connects adjacent chromosomal regions and helps in keeping chromosome territory structure in place during interphase.