900
Views
7
CrossRef citations to date
0
Altmetric
Research Paper

RRM3 regulates epigenetic conversions in Saccharomyces cerevisiae in conjunction with Chromatin Assembly Factor I

, , , &
Pages 405-414 | Received 27 May 2016, Accepted 11 Jul 2016, Published online: 09 Aug 2016

Figures & data

Figure 1. Frequency of epigenetic conversions at the VIIL telomere. (A) The URA3-tel construct was integrated in the VIIL telomere of the strains shown along the horizontal axis. Cells were selected in parallel on SC/5-FOA (upper graph) and SC-ura (lower graph) and single colonies were transferred to liquid YPD medium for 20 generations. Cultures were then serially (1:10) diluted and spotted on YPD, SC-ura and SC/5-FOA plates. Colonies were counted and the percentage of FOAR (black columns) and URA+ (open columns) was calculated. The data is from Supplemental Table 2. (B) Cells were selected on SC/ura (gray fill), and SC/5-FOA (black fill) and released in non-selective YPD medium. Aliquots were taken at the indicated number of generations and the percent of FOAR cells was measured and plotted. The data is from Supplemental Table 2.
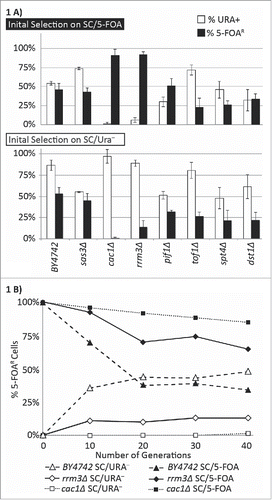
Figure 1. Frequency of epigenetic conversions at the VIIL telomere. (A) The URA3-tel construct was integrated in the VIIL telomere of the strains shown along the horizontal axis. Cells were selected in parallel on SC/5-FOA (upper graph) and SC-ura (lower graph) and single colonies were transferred to liquid YPD medium for 20 generations. Cultures were then serially (1:10) diluted and spotted on YPD, SC-ura and SC/5-FOA plates. Colonies were counted and the percentage of FOAR (black columns) and URA+ (open columns) was calculated. The data is from Supplemental Table 2. (B) Cells were selected on SC/ura− (gray fill), and SC/5-FOA (black fill) and released in non-selective YPD medium. Aliquots were taken at the indicated number of generations and the percent of FOAR cells was measured and plotted. The data is from Supplemental Table 2.

Figure 2. The deletion of CAC1 or ASF1 suppress the variegation phenotype in rrm3Δ. The URA3-tel construct was integrated in the VII-L telomere of the strains shown along the horizontal axis. Cells were selected in parallel on SC/5-FOA (upper graph) and SC/ura (lower graph) and single colonies were transferred to liquid YPD medium for 20 generations. Cultures were serially (1:10) diluted and spotted on YPD, SC/ura and SC/5-FOA plates. Colonies were counted and the percentage of FOAR (black columns) and URA+ (open columns) was calculated. The data is from Table 2.
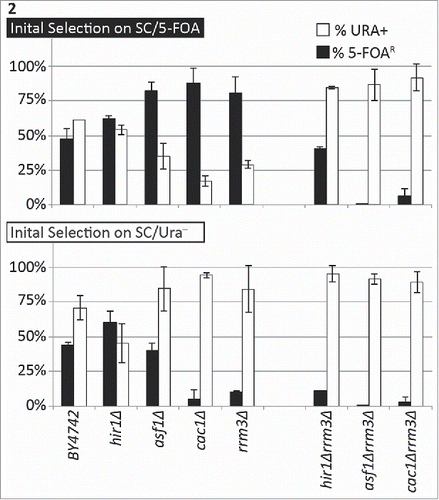
Figure 2. The deletion of CAC1 or ASF1 suppress the variegation phenotype in rrm3Δ. The URA3-tel construct was integrated in the VII-L telomere of the strains shown along the horizontal axis. Cells were selected in parallel on SC/5-FOA (upper graph) and SC/ura− (lower graph) and single colonies were transferred to liquid YPD medium for 20 generations. Cultures were serially (1:10) diluted and spotted on YPD, SC/ura− and SC/5-FOA plates. Colonies were counted and the percentage of FOAR (black columns) and URA+ (open columns) was calculated. The data is from Table 2.

Figure 3. The deletion of RRM3 exacerbates mutation rates in cac1Δ and asf1Δ cells. Five independent colonies from the strains shown along the horizontal axis were inoculated in liquid YPD cultures and grown for 20 generations. 2.5–4.5 ×10⁷ cells were plated on non-selective or SC/argcan+ plates, respectively, and grown at 30°C for 4–5 d. The mutation rates in CAN1 were calculated as number of colonies on SC/argcan+ divided by the number of plated cells. The asterisk indicates statistically significant values at p≤0.05. The data is from Supplemental Table 3.
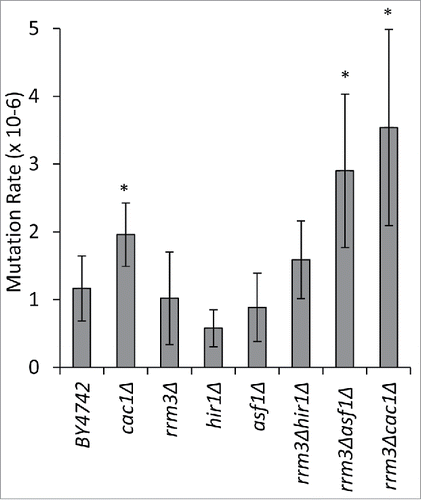
Figure 3. The deletion of RRM3 exacerbates mutation rates in cac1Δ and asf1Δ cells. Five independent colonies from the strains shown along the horizontal axis were inoculated in liquid YPD cultures and grown for 20 generations. 2.5–4.5 ×10⁷ cells were plated on non-selective or SC/arg−can+ plates, respectively, and grown at 30°C for 4–5 d. The mutation rates in CAN1 were calculated as number of colonies on SC/arg−can+ divided by the number of plated cells. The asterisk indicates statistically significant values at p≤0.05. The data is from Supplemental Table 3.

Figure 4. Cac1p and Rrm3p compete for binding to PCNA. The strains shown along the X axis were transformed with a LexAOP-LacZ reporter plasmid and bait and prey plasmids as indicated. Cell extracts were prepared and β-galactosidase activity (U/mg of protein) was measured. Average values from 2 independent experiments (3 biological replicates each) are plotted on the Y axis. The asterisk indicates statistically significantly difference from wildtype BY4742 cells at p≤0.05. Data is from Supplemental Table 4. (A) Cac1p-PCNA interaction. Cells transformed with pEG202-LexADBD-CAC1 and pBL240. (B) Rrm3p-PCNA interaction. Cells transformed with pEG202-LexADBD-RRM3 and pBL240. (C) Differential interaction of Rrm3p and Cac1p with PCNA. BY4724 cells transformed with pEG202-LexADBD-CAC1 or pEG202-LexADBD-RRM3 and pBL240 or pBL240-Y133A, respectively as indicated.
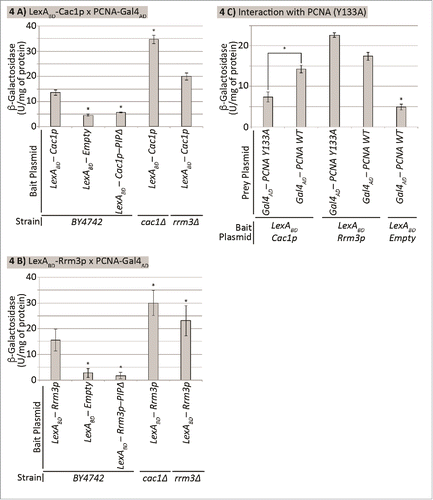
Figure 4. Cac1p and Rrm3p compete for binding to PCNA. The strains shown along the X axis were transformed with a LexAOP-LacZ reporter plasmid and bait and prey plasmids as indicated. Cell extracts were prepared and β-galactosidase activity (U/mg of protein) was measured. Average values from 2 independent experiments (3 biological replicates each) are plotted on the Y axis. The asterisk indicates statistically significantly difference from wildtype BY4742 cells at p≤0.05. Data is from Supplemental Table 4. (A) Cac1p-PCNA interaction. Cells transformed with pEG202-LexADBD-CAC1 and pBL240. (B) Rrm3p-PCNA interaction. Cells transformed with pEG202-LexADBD-RRM3 and pBL240. (C) Differential interaction of Rrm3p and Cac1p with PCNA. BY4724 cells transformed with pEG202-LexADBD-CAC1 or pEG202-LexADBD-RRM3 and pBL240 or pBL240-Y133A, respectively as indicated.
Supplemental material

SUPPLEMENTAL_INFORMATION.docx

Download MS Word (29.6 KB)

Reprints and Corporate Permissions

Please note: Selecting permissions does not provide access to the full text of the article, please see our help page How do I view content?

To request a reprint or corporate permissions for this article, please click on the relevant link below:

Academic Permissions

Please note: Selecting permissions does not provide access to the full text of the article, please see our help page How do I view content?

Obtain permissions instantly via Rightslink by clicking on the button below:

If you are unable to obtain permissions via Rightslink, please complete and submit this Permissions form. For more information, please visit our Permissions help page.