713
Views
2
CrossRef citations to date
0
Altmetric
Extra View

Extra views on structure and dynamics of DNA loops on nucleosomes studied with molecular simulations

, , , &
Pages 554-559 | Received 10 Oct 2016, Accepted 10 Nov 2016, Published online: 22 Nov 2016

Figures & data

Figure 1. Remosome model resulting from a molecular simulation. This snapshot presents the DNA loop generated by a 42 bp insert at the dyad position.Citation17 The image shows the solvent-excluded surfaces of the histone core (gray) and of the DNA (cyan, partially transparent) as well as the helical axis of the DNA (black). Note the sharp kink within the DNA loop on the left hand side of the image. Molecular graphics were generated with the UCSF Chimera package.Citation27
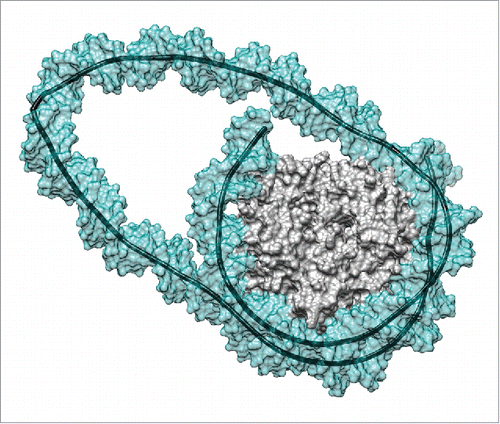
Figure 1. Remosome model resulting from a molecular simulation. This snapshot presents the DNA loop generated by a 42 bp insert at the dyad position.Citation17 The image shows the solvent-excluded surfaces of the histone core (gray) and of the DNA (cyan, partially transparent) as well as the helical axis of the DNA (black). Note the sharp kink within the DNA loop on the left hand side of the image. Molecular graphics were generated with the UCSF Chimera package.Citation27

Figure 2. Remosome model placed within the RSC remodeller. Two views of a nucleosome containing a 42 bp insertions at the dyad (DNA shown in cyan, histone core in gray) manually docked inside the 3D reconstruction of the RSC complex calculated from cryo-EM data.Citation3 (shown in yellow). A representative snapshot of the remosome model was taken from a 0.5 μs MD simulationCitation17 converted to a 25 Å-resolution density map to match the RSC data. DNA in the looped nucleosome is shown up to 25 bp from the ends, to account for the possible rearrangements in these zones.Citation3 Molecular graphics were generated with the UCSF Chimera package.Citation27,28
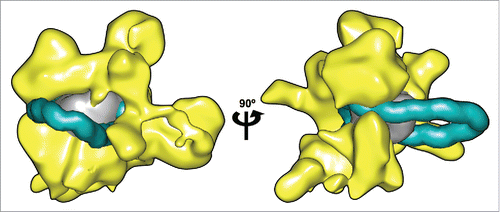
Figure 2. Remosome model placed within the RSC remodeller. Two views of a nucleosome containing a 42 bp insertions at the dyad (DNA shown in cyan, histone core in gray) manually docked inside the 3D reconstruction of the RSC complex calculated from cryo-EM data.Citation3 (shown in yellow). A representative snapshot of the remosome model was taken from a 0.5 μs MD simulationCitation17 converted to a 25 Å-resolution density map to match the RSC data. DNA in the looped nucleosome is shown up to 25 bp from the ends, to account for the possible rearrangements in these zones.Citation3 Molecular graphics were generated with the UCSF Chimera package.Citation27,28

Reprints and Corporate Permissions

Please note: Selecting permissions does not provide access to the full text of the article, please see our help page How do I view content?

To request a reprint or corporate permissions for this article, please click on the relevant link below:

Academic Permissions

Please note: Selecting permissions does not provide access to the full text of the article, please see our help page How do I view content?

Obtain permissions instantly via Rightslink by clicking on the button below:

If you are unable to obtain permissions via Rightslink, please complete and submit this Permissions form. For more information, please visit our Permissions help page.