
Figures & data
Figure 1. Expression of lamina proteins in the midgut. (A) Fixed adult midguts stained for GFP, Lam, DNA and F-actin. Color coding as indicated. Surface view and sagittal section. Intestinal stem cells (ISC) and enteroblast (EB) were genetically labelled by esg-GAL4 driven expression of GFP (green). Enterocytes (EC), enteroendocrine cell (EE), viceral muscle cell (Mu). Scale bars 25 μm. (B) Fixed midguts stained for indicated proteins of the nuclear envelope (gray), ISC/EBs (green), DNA (blue). Asterics: Nucleoplasmic Kuk staining in EC is unspecific as it is also observed in kuk deficient flies. (Fig. S1). Scale bars 25 μm, 5 µm, inset in 4x magnification.
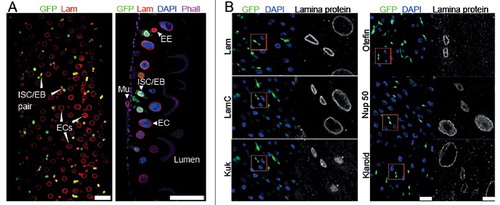
Figure 2. Lam overexpression inhibits ISC proliferation. (A, B) Flipout clones (green) in fixed adult midguts expressing GFP (A) or GFP and Lam or kuk or LamC-CaaX (B) stained for DNA (blue), GFP (green) and indicated lamina protein (grey). (A) Period after clone induction is indicated. (B) Five days after clone induction. The size of clones reflects proliferation during the period after clone induction. Inset, 3x magnification. (C) Expression levels of Lam, Kuk and LamC-CaaX analyzed by western blots with total gut extracts. SHMT serves as loading control. (D) Quantification of clone size expressing GFP (WT) Lam (+Lam) or Kugelkern (+Kuk). The area with GFP expression marking the clone(s) in relation to total gut area within the field of view. Five days after clone induction. Bars represent standard deviation. N, number of guts. Statistical significance was tested by students T-test, two tailed, two-sample unequal variance. P(WT vs. +Lam) = 3.6×10⁻⁵, P(WT vs. +Kuk) = 1.3×10⁻⁴. (E) Fixed midguts expressing GFP in ISC/EBs driven by Esg-GAL4 stained for GFP (green), DNA (blue) and the stem cell marker Delta (red). Expression was induced for 15 d. Arrowheads point to Delta and GFP positive cells. Insets 4x magnification. Scale bar 25 μm.
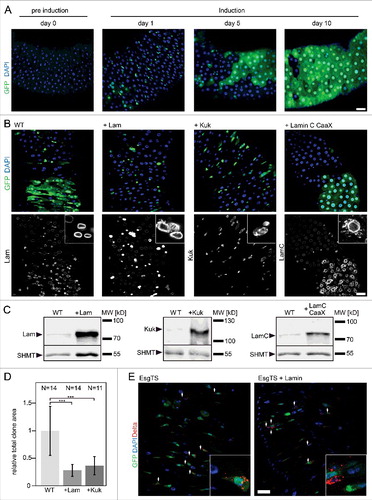
Figure 3. Lam overexpression inhibits pathogene induced proliferation. (A) Experimental scheme for Lam overexpression and Ecc15 infection. (B) Fixed gut stained for the mitotic marker pH3 (phospho-S10-Histone 3, red) and DNA (blue). Inset, higher magnification showing mitotic nuclei. (C) Mitotic cells per gut. Guts from flies expressing GFP or GFP and Lam and infected with E. coli (DH5α) or pathogenic Ecc15 were stained for the mitotic marker pH3. Bars represent standard deviation. N, sample size. Statistical significance was tested by Students T-test, two tailed, two-sample unequal variance. P(WT vs. Lam) = 9.2×10⁻⁴.
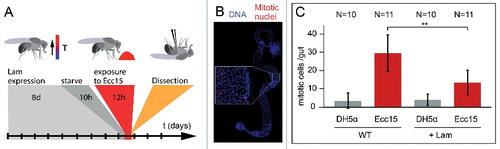
Figure 4. Lam overexpression does not change the distribution of the cell cycle stages. (A) Schematic of the FUCCI system. Labelling of G1, S and G2 phase by two reporter proteins (GFP-E2F1-N or RFP-Cyclin B-N). (B) Fixed midgut expressing FUCCI reporters in ISC/EBs. Arrowheads point to exemplary cells for G1, G2 or S phase. Examples shown in high magnification. Scale bar 25 μm. (C) Quantification of cell cycle stage distribution. Genotypes and infection as indicated. Lam was overexpressed in ISC/EBs with Esg-GAL4TS. N, sample size. Bars represent standard deviation.
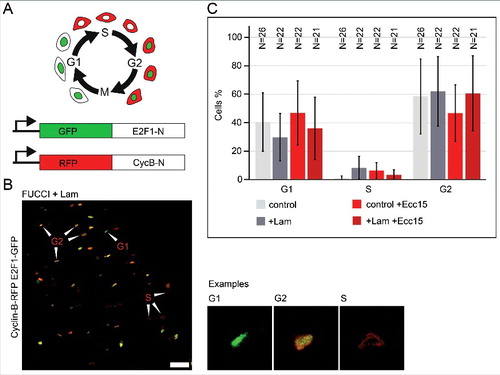
Figure 5. Lam overexpression does not inhibit Notch/Delta induced proliferation. (A) Fixed midguts with clonal expression of GFP (WT) or GFP and Lam and Notch RNAi as indicated (green, GFP) and stained for Lam (grey) and DNA (blue). Five days of induction time. Scale bar 25 μm. Insets, 4x magnification.(B) Quantification of clone size (cells per clonal area (μm2/1000). The area with GFP expression was related to the total gut area within the field of view. Five days after clone induction. Bars represent standard deviation. N, number of gut regions analyzed. Statistical significance was tested by students T-test, two tailed, two-sample unequal variance. P(WT vs. Notch RNAi) = 6.9×10⁻⁸, P(Notch RNAi vs. Notch RNAi +Lam) = 8×10⁻².
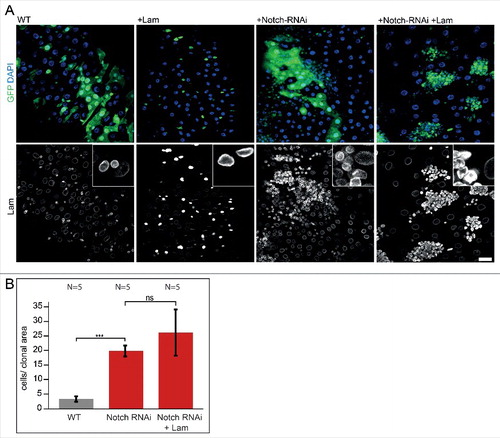
Figure 6. Lam and kuk overexpression inhibit upd induced proliferation. (A) Fixed guts with clonal expression of unpaired (upd) and Lam (+Lam) as indicated. Flipout clones (green, GFP), DNA (blue, DAPI), Lam (grey). Inset, 4x magnification. Five days of induction. (B, D) Quantification of clone size expressing GFP (WT), Lam, upd or kuk. The area with GFP expression marking the clone(s) in relation to total gut area within the field of view. Five days after clone induction. Bars represent standard deviation. N, number of guts. Statistical significance was tested by students T-test, two tailed, two-sample unequal variance. P(upd vs. upd +Lam) = 7.4×10⁻²⁰, P(upd vs. upd +kuk) = 9.5×10⁻¹⁶, P(WT vs. StatΔNΔC) = 1,9×10⁻³, P(StatΔNΔC vs StatΔNΔC +Lam) = 1,2×10⁻⁵ (C) Scheme of the Jak/Stat pathway with constitutive induction at the level of Stat by expression of StatΔNΔC. (E, F) Midguts with flipout clones expressing upd or upd+Lam were fixed and stained for Stat (green) and Lam (red). Inset, 4x magnification. Five days of induction. (F) Fluorescence intensities of Stat and Lam staining in clonal cells plotted against each other. Linear regression yields a reciprocal correlation of y = 123.16x−0.506. Scale bars 25 μm.
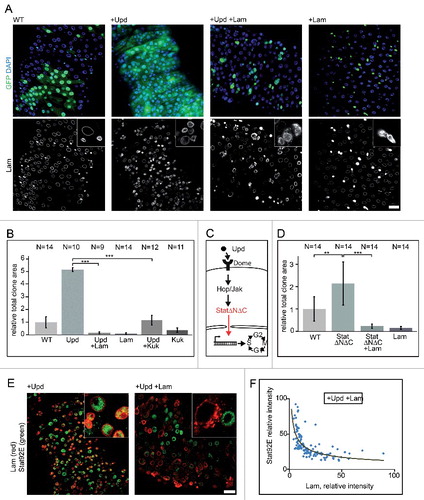
Figure 7. Lam overexpression normalizes expression of Jak/Stat target genes. (A) Experimental scheme for ISC/EB specific transcriptome analysis. Successful Lam overexpression in ISC/EBs was confirmed by significantly increased nuclear Lam immunofluorescence (Fig S8A). (B) Number of upd induced up- (red) and downregulated (blue) transcripts with (+Lam) or without Lam overexpression in ISC/EBs. (C) Change of upd target transcripts by Lam overexpression. Upper and lower panel show upregulated (red) and downregulated (blue) upd target genes sorted by changes in expression level. Middle panels show changes of each target gene upon Lam overexpression. Red indicates upregulation (higher than twofold), blue downregulation (lower then twofold) and gray return to normal expression (normalization).
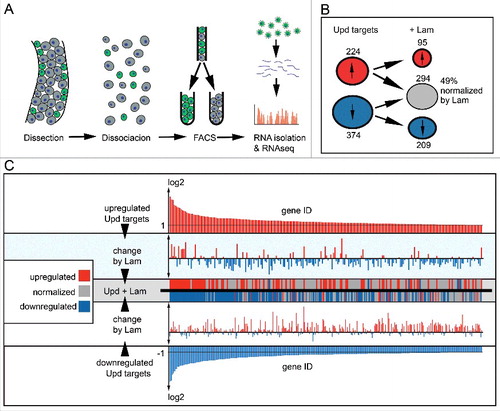
Figure 8. Model. Lam overexpression antagonizes Stat protein levels and normalizes Jak/Stat target gene expression, including normalization of domeless expression. As a consequence of reduced Jak/Stat signaling, and possibly other pathways, Notch/Delta independent proliferation regulation is suppressed.
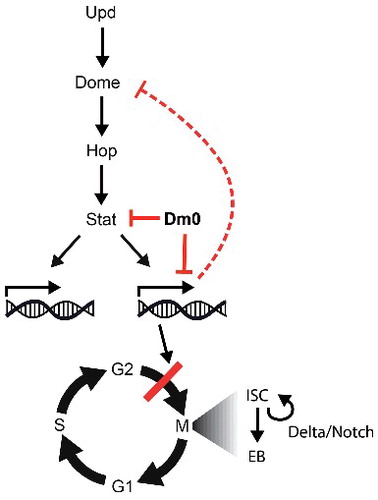
Table 1. Drosophila stocks used in this work.
Table 2. Primary antibodies.
2017NUCLEUS0052R-s02.docx
Download MS Word (9.2 MB)Data availability statement
RNA seq data: GEO Submission number (GSE97307) [NCBI tracking system #18363487].