Figures & data
Figure 1. Cytokine level is affected in muscular laminopathies. (A) Levels of TGF β2 in sera of healthy donors (control), patients affected by muscular laminopathies (LMNA) and patients affected by other neuromuscular diseases, including Duchenne Muscular dystrophy, Becker muscular dystrophy and Myotonic Dystrophy (others). (B) Levels of TGF β2, IL6, IL17 and FGF-b in sera of controls and LMNA symptomatic patients. Based on cytokine expression pattern, sera from LMNA symptomatic patients are divided in three subgroups (LMNA1, LMNA2, LMNA3); the percentage of patients in each subgroup out of all examined LMNA patients is reported. (C) Levels of TGF β1, TGF β2, TGF β3 in sera of controls and LMNA patients. (D) Representative image of immunofluorescence detection of TGF β2 (green) in control and LMNA muscle tissue (in this case R190Q/R249Q heterozygous compound mutation in LMNA was determined in the EDMD2 patient). Nuclei are stained with DAPI. Bar: 10µm. (E) Scheme of LMNA mutations detected in laminopathic patients examined in this study. Means ± standard deviation are shown in graphs. Statistically significant differences are indicated by an asterisk (p<0.05), double asterisk (p<0.01) or triple asterisk (p< 0.001).
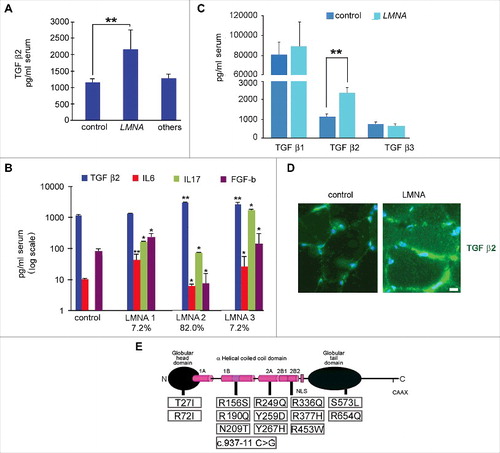
Table 1. List of patients involved in the study.
Figure 2. TGF β2 level is increased in laminopathic mice. (a) Levels of TGF β2 in sera of WT mice (n = 6) and LmnaH222P/H222P mice (LmnaH222P ) (n = 5). (b) Levels of TGF β2 secreted by fibroblasts isolated from WT mice (Lmna +/+), mice bearing heterozigous (Lmna +/−) or homozygous (Lmna −/−) null mutation in Lmna gene and maintained in culture for 5 days. Means ± standard deviation are shown in graphs. Statistically significant differences are indicated by an asterisk (p<0.05) or double asterisk (p< 0.01).
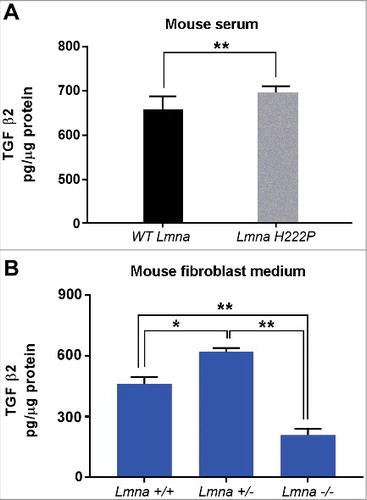
Figure 3. EDMD2 fibroblast medium induces TGF β2-dependent fibrogenic conversion in NHM cultures. (A) TGF β2 secretion in control and EDMD2 fibroblast culture medium. (B) Quantification of myofibroblasts in cultures of control human myoblasts maintained in medium conditioned by control (control) or EDMD2 (EDMD2) fibroblasts or treated with TGF β2 (control + TGF β2). The number of myofibroblasts was determined by counting alpha-SMA positive mononucleated cells (200 cells/sample were counted in three independent experiments). (C) Immunofluorescence staining of collagen I (green) and desmin (red) in cycling and differentiated NHM cultured in presence of medium conditioned by control or EDMD2 fibroblasts, treated (anti-TGFβ2) or not (NT) with anti-TGF β2 neutralizing antibodies. Nuclei were stained with DAPI. Bar: 10µm. (D) Immunofluorescence staining of ED-fibronectin (red) in cryosections of muscle tissue isolated from healthy donors (control), EDMD2 patients (EDMD2) or Becker muscular dystrophy patients (BMD). Nuclei were stained with DAPI. BMD tissue was used as positive control. In control muscle, ED-fibronectin is restricted to the area surrounding blood vessels. Bar: 10µm. (E) Quantitative analysis of proliferating cells in NHM cultures maintained in medium conditioned by control or EDMD2 fibroblasts, treated (anti-TGF β2) or not (NT) with anti-TGF β2 neutralizing antibodies. The number of proliferating cells was determined by flow cytometry. Means ± standard deviation are shown in graphs. Statistically significant differences are indicated by double asterisk (p<0.01) or triple asterisk (p< 0.001).
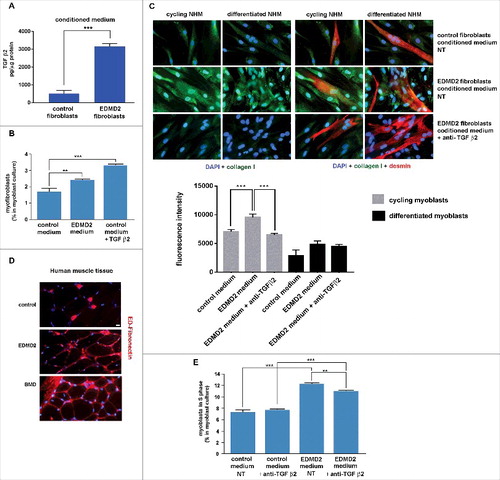
Figure 4. EDMD2 fibroblast medium inhibits differentiation of NHM through TGF β2. (A) Immunofluorescence staining of myogenin (red) and caveolin 3 (green) in C2C12 myoblasts cultured in presence of control or EDMD2 fibroblast medium. Data from samples left untreated (NT) or treated with anti-TGF β2 antibody (anti-TGF β2) are reported. Nuclei are counterstained with DAPI. Bar: 10µm. (B) Percentage of differentiated cells in C2C12 myoblast cultures conditioned by control or EDMD2 medium. Data from samples left untreated (NT) or treated with anti-TGF β2 antibody (anti-TGF β2) are reported. (C) Percentage of differentiated NHM conditioned by EDMD2 medium. Data from samples left untreated (NT) or treated with anti-TGF β2 antibody (anti-TGF β2) are reported. Means ± standard deviation are shown in graphs. Statistically significant differences are indicated by an asterisk (p<0.05) or double asterisk (p< 0.01).
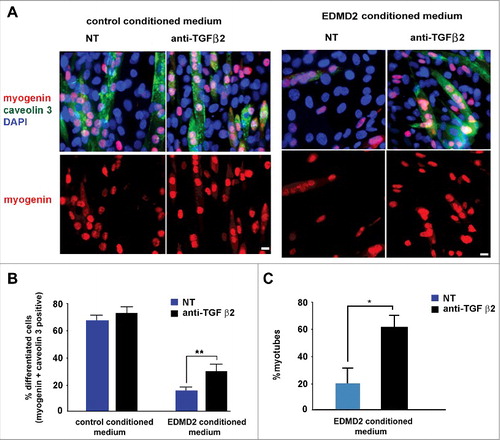
Figure 5. TGF β2 from EDMD2 serum induces fibrosis markers in normal human tenocytes. (A) Immunofluorescence staining of alpha-SMA in normal human tenocytes cultured in the presence of control serum, control serum + TGF β2, EDMD2 serum or EDMD2 serum + anti-TGF β2. Nuclei were counterstained with DAPI. Bar, 20 μm. Quantitative analysis of mean fluorescence intensity of alpha-SMA is reported in the graph. (B) Western blot analysis of ED-fibronectin, tenomodulin and alpha-SMA in control tenocytes exposed to control serum, control serum + TGF β2 or EDMD2 serum. Densitometric analysis of immunoblotted bands is reported in the graphs. Means ± standard deviation are shown in graphs. Statistically significant differences are indicated by an asterisk (p<0.05), double asterisk (p< 0.01) or triple asterisk (p< 0.001).
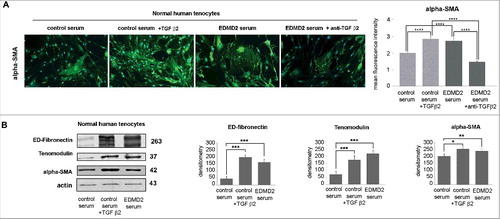
Figure 6. TGF β2 affects the AKT/mTOR pathway in EDMD2. Western blot analysis of p-mTOR, mTOR, Thr308 Akt, Ser473 Akt, Akt and actin performed in (A) control myoblasts (control), EDMD2 myoblasts (EDMD2) and EDMD2 myoblasts treated with anti-TGF β2 neutralizing antibody (EDMD2 + anti-TGF β2) or (B) control fibroblasts (control), EDMD2 fibroblasts (EDMD2) and EDMD2 fibroblasts treated with anti-TGF β2 neutralizing antibody (EDMD2 + anti-TGF β2). Actin bands are shown as protein loading control. Molecular weight markers are reported in kDa. Densitometric analysis of immunoblotted bands normalized on actin is reported in the graphs. Means ± standard deviation are shown in graphs. Statistically significant differences are indicated by an asterisk (p<0.05), double asterisk (p< 0.01) or triple asterisk (p< 0.001).