
Figures & data
Figure 1. Nuclear basket Nups. (a) schematic illustration of overall structure of the NPC in yeast and vertebrate [Citation78,Citation208,Citation209]. (b) schematic overview of nuclear basket Nup organization of the NPC in vertebrates. (c) relative sizes of nuclear basket Nups annotated with regions of note.
![Figure 1. Nuclear basket Nups. (a) schematic illustration of overall structure of the NPC in yeast and vertebrate [Citation78,Citation208,Citation209]. (b) schematic overview of nuclear basket Nup organization of the NPC in vertebrates. (c) relative sizes of nuclear basket Nups annotated with regions of note.](/cms/asset/26fd8e2f-b950-45c1-9cd5-9ac9968c0b9d/kncl_a_2076965_f0001_oc.jpg)
Figure 2. Models of successful and abortive nuclear export of mRNPs tracked via high-speed single-molecule SPEED microscopy. (a) A model of successful export coupled with a typical successful export trajectory. (b) A model of abortive export at the nuclear basket coupled with a typical nuclear basket abortive export trajectory. (c) A model of abortive export at the central scaffold coupled with a typical central scaffold abortive export trajectory. (d) A model of abortive export at the cytoplasmic fibril coupled with a typical cytoplasmic fibril abortive export trajectory. partial figure reprinted with permission. originally published in proceedings of the national academy of sciences.[Citation129]
![Figure 2. Models of successful and abortive nuclear export of mRNPs tracked via high-speed single-molecule SPEED microscopy. (a) A model of successful export coupled with a typical successful export trajectory. (b) A model of abortive export at the nuclear basket coupled with a typical nuclear basket abortive export trajectory. (c) A model of abortive export at the central scaffold coupled with a typical central scaffold abortive export trajectory. (d) A model of abortive export at the cytoplasmic fibril coupled with a typical cytoplasmic fibril abortive export trajectory. partial figure reprinted with permission. originally published in proceedings of the national academy of sciences.[Citation129]](/cms/asset/854d7f60-bc72-4957-9568-627b763e14ed/kncl_a_2076965_f0002_oc.jpg)
Figure 3. Correlation between copy number of Nup153 and its impact on mRNP export dynamics. (a) the copy number of Nup153 present within the NPC directly impacts the efficiency of export. numbers denote the three phases between the nuclear export efficiency of mRNAs and the copy number of Nup153. (b) the copy number of Nup153 unlikely impact export time of mRNPs. (c) correlation between docking frequency and the copy number of Tpr. partial figure reprinted with permission. originally published in proceedings of the national academy of sciences.[Citation129]
![Figure 3. Correlation between copy number of Nup153 and its impact on mRNP export dynamics. (a) the copy number of Nup153 present within the NPC directly impacts the efficiency of export. numbers denote the three phases between the nuclear export efficiency of mRNAs and the copy number of Nup153. (b) the copy number of Nup153 unlikely impact export time of mRNPs. (c) correlation between docking frequency and the copy number of Tpr. partial figure reprinted with permission. originally published in proceedings of the national academy of sciences.[Citation129]](/cms/asset/1712bbc8-306a-4e26-8ee0-733848c37773/kncl_a_2076965_f0003_oc.jpg)
Figure 4. Three-Dimensional export routes of mRNPs. (A-D) An axial view of the 3D probability density maps for mRNPs under different conditions. Shown here is the entirety of the NPC, including nuclear basket, central channel, and cytoplasmic fibrils. Red indicates high probability localizations while yellow indicates a low probability localization. (e-h) A radial view of 3D probability density maps for mRNPs under different conditions. shown here are subregions of the NPC including nuclear basket, central channel, and cytoplasmic fibrils. partial figure reprinted with permission. originally published in proceedings of the national academy of sciences.[Citation129]
![Figure 4. Three-Dimensional export routes of mRNPs. (A-D) An axial view of the 3D probability density maps for mRNPs under different conditions. Shown here is the entirety of the NPC, including nuclear basket, central channel, and cytoplasmic fibrils. Red indicates high probability localizations while yellow indicates a low probability localization. (e-h) A radial view of 3D probability density maps for mRNPs under different conditions. shown here are subregions of the NPC including nuclear basket, central channel, and cytoplasmic fibrils. partial figure reprinted with permission. originally published in proceedings of the national academy of sciences.[Citation129]](/cms/asset/b04db6bd-5821-40f0-9d13-83fcf225782b/kncl_a_2076965_f0004_oc.jpg)
Figure 5. Updated simplified model of mRNP export as it moves through the NPC. (A) formation: the formation of an mRNP including nuclear transport receptor and other co-factors. (B) docking: Docking at the nuclear basket via interaction with TPR. (C) initiation: Initiation of export by interactions between nuclear transport receptor and Nup153. (D) transport: Movement through the central channel facilitated by interactions between transport receptor and FG-Nups. (E) Release: Release from the cytoplasmic fibrils. (F) diffusion: Translocation from the NPC to the ribosome.
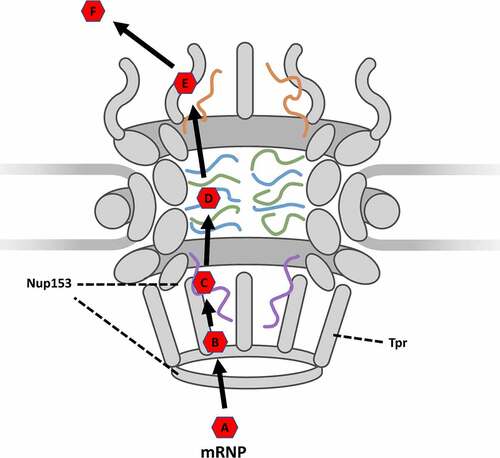
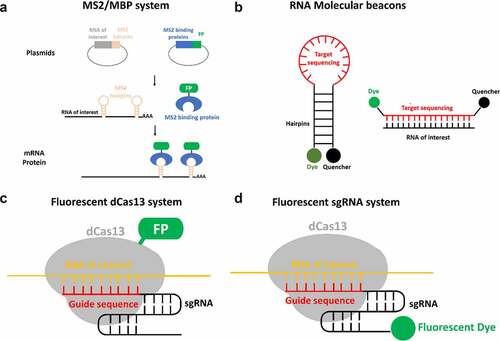
Figure 6. Alternative approaches of live-cell RNA tagging for subsequent single-molecule imaging super-resolution imaging. (a) The MS2/MBP system requires the construction of two plasmids. One construct encodes the RNA of interest with MS2 hairpin repeats. Another construct encodes the MS2 binding protein (MBP) fused with a fluorescence protein such as GFP. By transfection, both plasmids are transcribed and the MBP-FP are translated. The exogenous RNA of interest is recognized and bound by the fluorescent MBP. (b) The molecular beacon structure is a stem-loop probe. The stem-loop structure brings the fluorescent dye close to the quencher molecule. This quencher absorbs the energy emitted by the dye, reducing fluorescent background noise. When the loop containing the targeting sequence hybridizes with the RNA of interest, the hairpin dissociates. This separation moves the fluorescent dye out of range of the quencher, allowing emission of detectable fluorescence. (c) The assembly of fluorescent protein fused dCas13 protein (dCas13-FP) and sgRNA is directed by guide sequence of sgRNA to bind to RNA of interest and label target RNA with dCas13-FP. (d) the assembly of dCas13 and fluorescent sgRNA (F-sgRNA) binds to the RNA of interest and labels the target RNA with sgRNA conjugated with fluorescent dye.
Data Availability Statement
Data supporting this review are published and available at the Proceedings of the National Academy of Sciences https://doi.org/10.1073/pnas.2015621118