Figures & data
Figure 1. PRR14 tethers H3K9me3-modified heterochromatin to the nuclear lamina. Schematic illustrations of (a) PRR14 domain organization, functional motifs and (b) mechanism of heterochromatin tethering to the nuclear lamina. Amino acid residues in (A) refer to human protein coordinates. NLS, nuclear localization signal. (c-d) Representative confocal images of (c) murine NIH/3T3 and (d) human IMR-90 cells expressing GFP-tagged PRR14 constructs (green): wildtype (WT) or mutant V54E, V55E (54-55EE) and stained for H3K9me3 (cyan) and Lamin A/C (red). DAPI counterstain shown in gray. Dot plots show the fraction of H3K9me3 signal at the nuclear lamina. n ≥ 30 cells per condition. Lines on dot plot show median values. (e-f) Representative confocal images of (e) NIH/3T3 and (f) IMR-90 cells transfected with control or Prr14-specific siRNAs and stained as in panels C and D. Dot plots show the fraction of H3K9me3 signal at the nuclear lamina. n ≥ 30 cells per condition. Lines on dot plots show median values. Fraction of the H3K9me3 signal at the nuclear lamina was calculated using a nuclear lamina mask created with the Lamin A/C signal. Statistical analysis was performed using ANOVA Kruskal–Wallis test with Dunn’s multiple comparisons and Mann–Whitney test; ****p < 0.0001, ***p < 0.001, *p < 0.05, ns: not significant. Scale bars 5 μm.
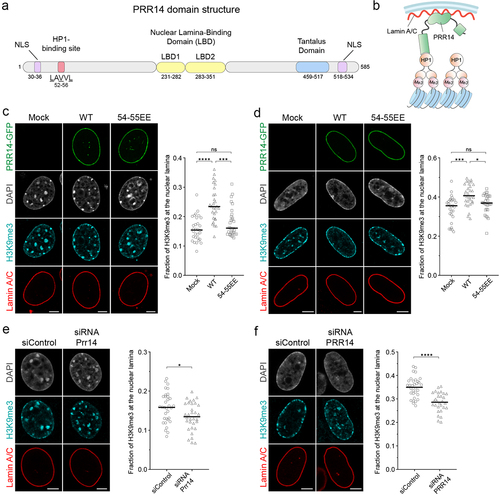
Figure 2. PRR14 organizes H3K9me3-modified heterochromatin at the nuclear lamina in interphase nuclei independent of mitosis. (a) Representative confocal images of cell cycle-arrested and cycling murine NIH/3T3 cells expressing WT GFP-tagged PRR14 constructs (green), stained for H3K9me3 (cyan). DAPI counterstain shown in gray. (b) Dot plot shows the fraction of H3K9me3 signal at the nuclear lamina. Lines on dot plot show median values. n ≥ 30 cells per condition. Statistical analysis was performed using ANOVA Kruskal–Wallis test with Dunn’s multiple comparisons; ****p < 0.0001, ns: not significant. Scale bars 5 μm.
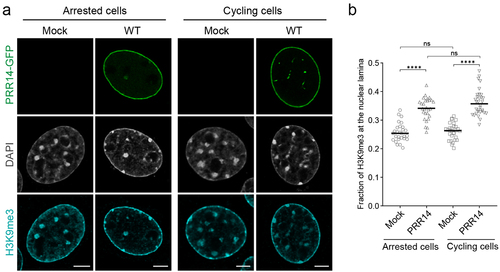
Figure 3. PRR14 interacts with heterochromatin primarily through its HP1-binding site 1. (a) Schematic illustrations of PRR14 domain organization and HP1-binding site motifs: LAVVL (aa 52–56) and LVVML (aa 153–157). (b) Schematic representation of GFP-tagged PRR14 (Citation1–212) fragments including the heterochromatin-binding domain of PRR14 with indicated amino acid substitutions in key residues of HP1-binding motifs. DM, double mutant. (c) Representative confocal images of murine NIH/3T3 cells expressing indicated WT or mutant GFP-tagged PRR14 (Citation1–212) constructs (green), counterstained with Hoechst (blue). (d) Dot plot shows the Pearson’s correlation of Hoechst staining and GFP-PRR14 signal for each PRR14 (Citation1–212) construct indicating degree of colocalization of PRR14 with heterochromatin regions. n ≥ 16 cells per condition. Lines on the dot plot show median values. Statistical analysis was performed using ANOVA Brown-Forsythe and Welch test with Dunnett’s multiple comparisons; ****p < 0.0001, **p < 0.01. Scale bars 5 μm.
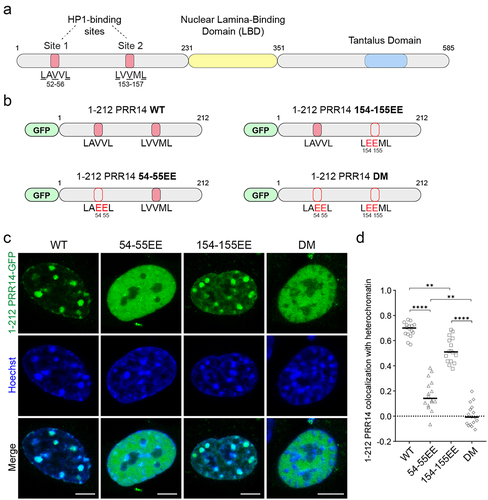
Figure 4. PRR14 HP1-binding site 2 stabilizes PRR14-heterochromatin interactions. (a) Representative confocal images of fluorescent recovery after photobleaching (FRAP) assay for PRR14 (Citation1–212) WT and 154–155EE mutant constructs. White boxes indicate the bleached area which are shown as magnified, grayscale images. (b) Line graph shows normalized fluorescent recovery over time after photobleaching in the areas indicated in (A) in cells expressing PRR14 (Citation1–212) WT (blue) or 154–155EE mutant (red). Line graph shows mean values with standard deviations displayed as shading. (c) Box plots show distributions of recovery half-times for indicated PRR14 (Citation1–212) constructs. (d) Box plots show distributions of immobile fractions for indicated constructs. n ≥ 12 cells per condition. Box plots show median, 25th and 75th percentiles. Whiskers show minimum to maximum range. Statistical analysis was performed using Mann–Whitney test. ***p < 0.001, ns: not significant. Scale bars 5 μm.
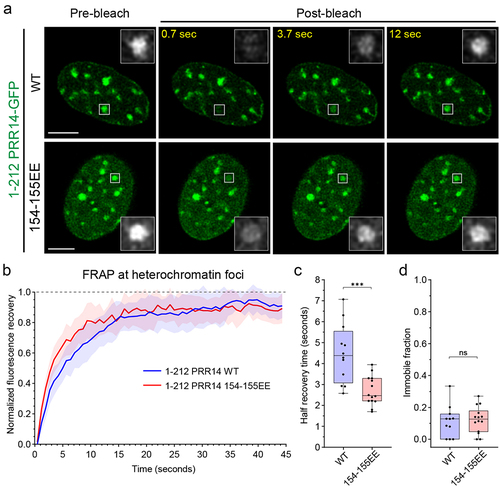
Figure 5. PRR14 tethers chromatin to the nuclear lamina primarily through interactions with HP1α and HP1β. (a) Representative confocal images of murine NIH/3T3 cells mock transformed or expressing GFP-PRR14 WT or mutant constructs (green) and stained for HP1 isoforms (gray) as indicated. DAPI counterstain shown in gray. (b) Dot plots show ratio of indicated HP1 protein signal at the nuclear lamina for murine NIH/3T3 cells expressing GFP-PRR14 WT or mutant constructs as indicated. (c) Lysates of 293 T cells expressing indicated GFP-PRR14 (Citation1–212) constructs were immunoprecipitated (IP) with anti-GFP antibody and analyzed by Western blotting using antibodies against the indicated HP1 isoform. IgG serves as an isotype control for nonspecific antibody interactions. (d) Dot plots show IgG normalized intensities of indicated HP1 signal after immunoprecipitation with anti-GFP antibodies. n = 3 independent immunoprecipitations. Lines on dot plots show average values. Whiskers show range. Lines on dot plots show average values. n ≥ 30 cells per condition. Statistical analysis was performed using ANOVA Kruskal–Wallis test with Dunn’s multiple comparisons for panel B and paired ANOVA test with Geisser-Greenhouse correction for panel D; ****p < 0.0001, ***p < 0.001, **p < 0.01, *p < 0.05, ns: not significant. Scale bars 5 μm.
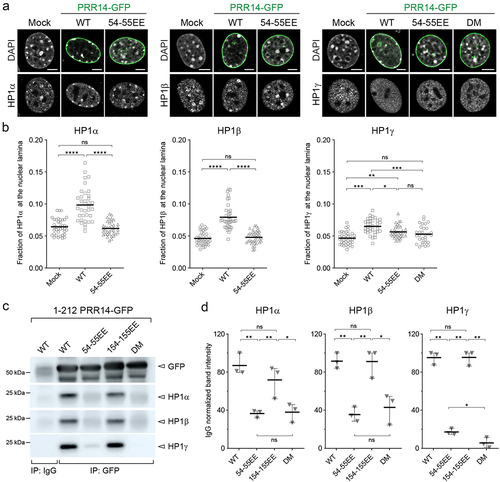
Figure 6. PRR14 association with the nuclear lamina is dynamic and independent of PRR14-heterochromatin binding. (a) Representative confocal images of fluorescence recovery after photobleaching (FRAP) assay of WT GFP-PRR14 full-length (PRR14 FL) and lamina-binding domain (LBD) constructs. White boxes indicate bleached area. Grayscale images show magnified bleached areas indicated by white arrows. (b) Line graph shows normalized FRAP signal in the areas indicated with boxes in (A) for PRR14 full-length (blue) and PRR14 LBD-only fragment (purple). (c) Box plots show distributions of recovery half-time (left) and immobile fraction (right) for indicated constructs. (d) Line graph shows normalized FRAP signal in the areas indicated with boxes (Fig. S6) for PRR14 FL WT (blue) and mutant full-length constructs 54-55EE (red), or double mutant (DM; yellow). (e) Box plots show distributions of recovery half-time (left) and immobile fraction (right) for indicated constructs. n ≥ 12 cells per condition. Line graphs show mean values with standard deviations displayed as shading. Box plots show median, 25th and 75th percentiles; whiskers show minimum to maximum range. Statistical analysis was performed using Mann–Whitney test and ANOVA Kruskal–Wallis test with Dunn’s multiple comparisons. ****p < 0.0001, ns: not significant. Scale bars 5 μm.
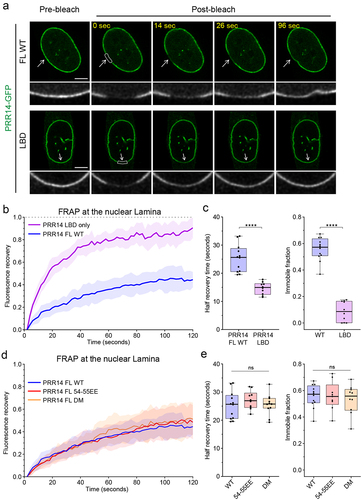
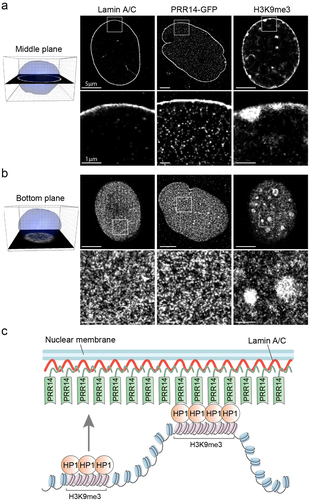
Figure 7. PRR14 is predominantly localized at the nuclear lamina where it creates a surface for anchoring HP1-associated H3K9me3-modified heterochromatin. (a) Representative super-resolution stochastic optical reconstruction microscopy (STORM) images from cells overexpressing PRR14-GFP show localization of Lamin A/C, PRR14 and H3K9me3 in the middle plane of nuclei of NIH/3T3 cells. White boxes (top panels) show zoomed areas (bottom panels). (b) Representative STORM images from cells overexpressing PRR14-GFP show localization of Lamin A/C, PRR14 and H3K9me3 at the bottom plane of nuclei of NIH/3T3 cells. (c) A model illustrating the mechanism for PRR14 tethering H3K9me3-modified chromatin to the nuclear lamina through interaction with HP1. Scale bars: 5 μm (top panels) and 1 μm (bottom panels).