
Figures & data
Figure 1. Initialization, equilibration, and analysis of the polymer and shell model for the cell nucleus. (a) Schematic illustration of the MD simulation model, with block copolymer and deformable shell structures. Chromosome-like structures composed of 8 tri-block polymers are placed randomly and confined inside the shell. Initial structures were run sequentially to obtain conventional and inverted nuclei. (b) The density profiles of the different polymeric blocks in our simulations in conventional and inverted nuclei after relaxation. (c) A schematic illustration of the analysis and metrics used to quantify nuclear shape fluctuations.
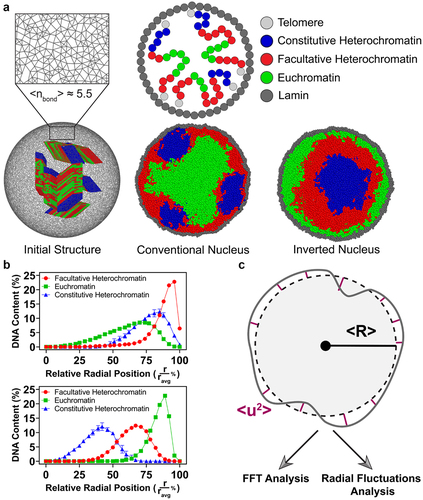
Figure 2. The effect of polymer volume fraction on nuclear shape fluctuations in conventional and inverted nuclei. (a) Shape fluctuation analysis was conducted on simulations at various volume fractions for conventional nuclei at three different volume fractions (φ = 14%, φ = 19%, and φ = 23%). The constitutive heterochromatin domains (blue) are crosslinked or not and the LJ potential, uCC, between constitutive heterochromatin beads, is switched on and off, as indicated by ± beneath each bar in the bar plot at right. (b) The Fourier spectrum of fluctuations and the RMS amplitudes plotted for inverted simulations. (c) Representative snapshots of chromatin spatial organization and nuclear morphology in conventional and inverted scenarios for different chromatin volume fractions.
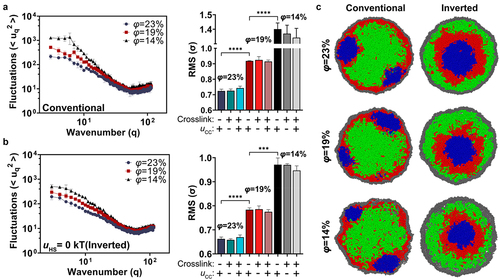
Figure 3. Heterochromatin-shell interactions influence nuclear shape fluctuations and morphology. (a) Nuclear shape fluctuations were calculated in conventional nucleus simulations in which the interaction between heterochromatin (facultative and constitutive) and the shell was altered. The volume fraction was set to φ = 19%. (b) RMS nuclear shape fluctuations in three different scenarios of heterochromatin-lamina interactions: one in which only constitutive heterochromatin is attracted to the lamina, one in which only facultative heterochromatin is attracted to the lamina, and one in which both types of heterochromatin are attracted to the lamina. (c) Snapshots of three different simulations with different strengths of heterochromatin-lamina interactions., where both heterochromatin types are attracted to the lamina.
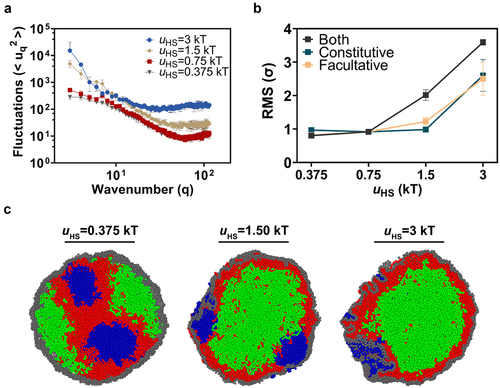
Figure 4. The interplay between heterochromatin-heterochromatin and heterochromatin-shell interactions. (a-d) Fourier spectra of nuclear shape fluctuations and corresponding snapshots for different self-affinities of heterochromatin (different for different colors in each plot and increasing from left to right across each row) and different heterochromatin-shell interactions strengths (increasing from top row to bottom row). (a) the attraction affinities between facultative heterochromatin domains are varied, and the shell is set to uHS = 0.375 kT. The polymer volume fraction is set to φ = 19%. (b) The attraction affinity between shell and heterochromatin domains is set to uHS = 0.75 kT. (c) the attraction affinity between shell and heterochromatin domains is set to uHS = 1.5 kT. (d) the attraction affinity between shell and heterochromatin domains is set to uHS = 3 kT.
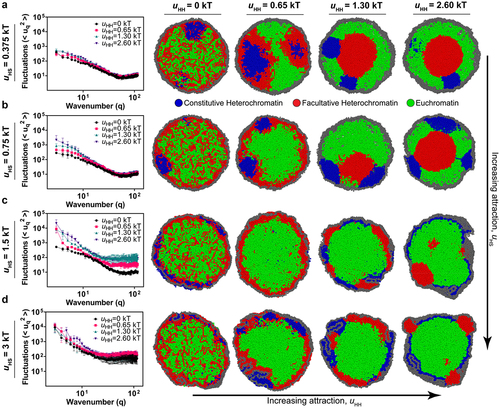
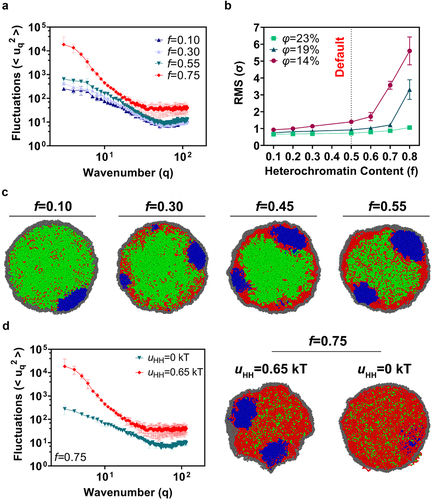
Figure 5. The facultative heterochromatin content at the nuclear periphery impacts the nuclear morphology. (a) Fourier spectra of shape fluctuations for conventional and inverted nuclei simulations, where the facultative heterochromatin content is set to f = 10%, f = 30%, f = 45%, f = 55%, and f = 75%. The polymer volume fraction is set to φ = 19%. (b) RMS fluctuation amplitudes for varying levels of facultative heterochromatin at different volume fractions, with the value for standard simulations labeled as “default.” (c) Representative simulation snapshots for simulations with different levels of facultative heterochromatin. (d) Shape fluctuations with and without heterochromatin self-affinity for f = 75% case, along with simulation snapshots. Reducing self-affinity inhibits shape fluctuations in this scenario.
Supplemental Material
Download MS Word (17 MB)Data availability statement
All codes, structure files, and input parameters are available online under at https://github.com/agattar/Attar_ElasticShellModel.git.