Figures & data
Table 1. Translating aims into Boolean strings.
Table 2. Sample reduction.
Figure 1. Timeline maps. Source: Soaita (Citation2018b, p. 9).
Note: for a similar approach related to the evolution of 12 city concepts in SCOPUS database, see de Jong et al. (Citation2015, p. 29).
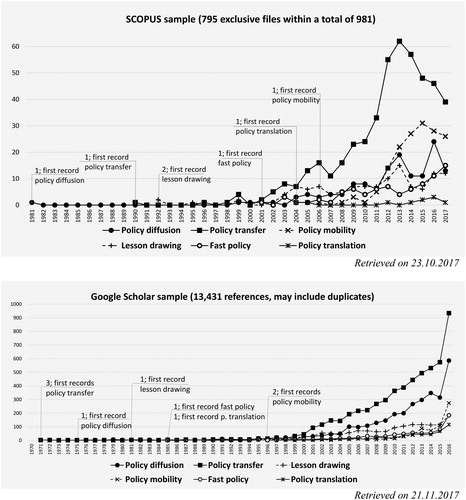
Figure 2. Conceptual and geographical patterns. Source: Soaita (Citation2018b, p. 17).
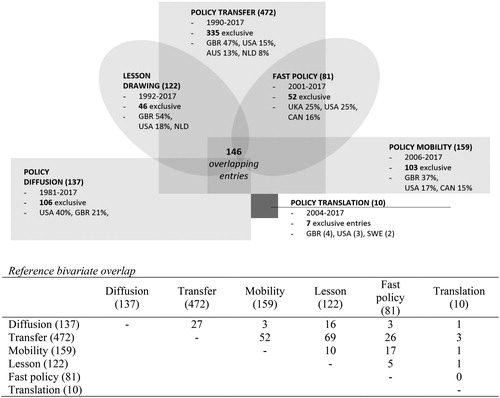
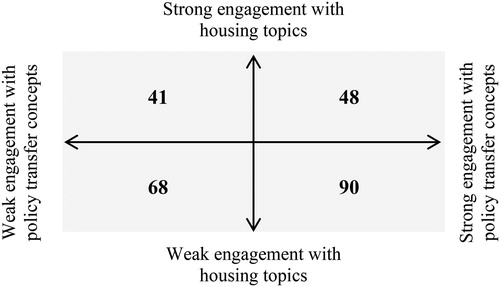
Figure 3. Conceptual and thematic engagement. Source: authors’ graphics.