Figures & data
Figure 1. Development of the number of housing-association units (total and rent regulated), dwellings and households 2007–2017 (indexed, 2007 = 100). Source: Aedes (Citation2019) for housing-association units; CBS (Citation2018) for households and total dwellings
![Figure 1. Development of the number of housing-association units (total and rent regulated), dwellings and households 2007–2017 (indexed, 2007 = 100). Source: Aedes (Citation2019) for housing-association units; CBS (Citation2018) for households and total dwellings](/cms/asset/02cc58d7-d885-4e75-b6d3-55550fb42c38/reuj_a_1682234_f0001_b.jpg)
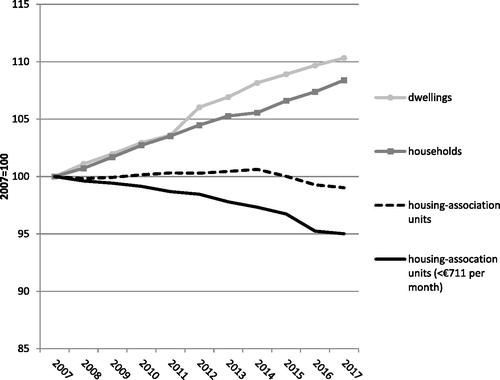
Table 1. New construction by housing associations.