Figures & data
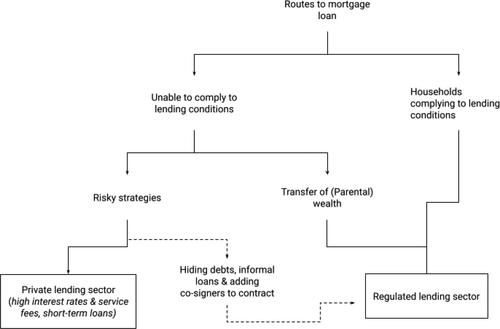
Figure 1. Mortgage debt Canada and the Netherlands 2004–2010.
This figure shows the collective outstanding residential mortgage debt as a share of the Gross Domestic Product in Canada and the Netherlands between 2004 and 2010. Source: CBS (Citation2005, Citation2014, Citation2019), StatCan (Citation2019) and the World Bank (Citation2019).
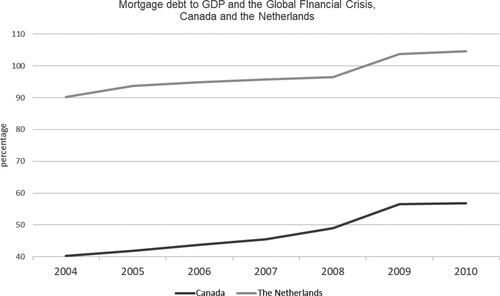
Table 1. Timeline of mortgage rule changes in Canada.
Table 2. Timeline of mortgage rule changes in the Netherlands.
Table 3. Comparison mortgage rule changes.
Figure 2. Simplified roadmap to mortgage loans in Canada and the Netherlands after the GFC.