Lighting a path: genetic studies pinpoint neurodevelopmental mechanisms in autism and related disorders
lluminando el camino: los estudios genéticos identifican mecanismos del neurodesarrollo en el autismo y los trastornos relacionados
Une voie éclairée: des études génétiques mettent en évidence les mécanismes neurodéveloppementaux dans l'autisme et dans des troubles liés
Matthew F. Pescosolidoa Department of Molecular Biology, Cell Biology and Biochemistry; and Institute for Brain Science; Developmental Disorders Genetics Research Program, Emma Pendleton Bradley Hospital and Department of Psychiatry and Human Behavior
,
Unikora Yangb Department of Molecular Biology, Cell Biology and Biochemistry; and Institute for Brain Science;
,
Mark Sabbaghb Department of Molecular Biology, Cell Biology and Biochemistry; and Institute for Brain Science;
&
Eric M. Morrowc Developmental Disorders Genetics Research Program, Emma Pendleton Bradley Hospital and Department of Psychiatry and Human Behavior; Brown University Medical School, Providence, Rhode Island, USACorrespondence[email protected]
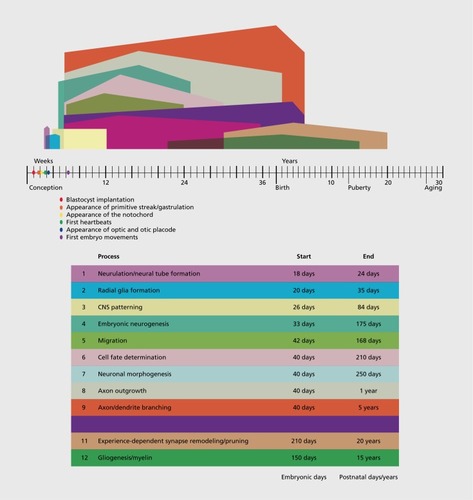
Figure 1. Timeline of human brain development. This figure represents a schematized conceptualization of the steps during human brain development. Time in weeks post-conception and then postnatal years are shown along the horizontal axis. Birth and puberty and age at which cerebral cortex begins to thin are shown. The onset, peak, and end of different stages of neurodevelopment are depicted in color-coded fashion as shown in the associated table. “Days” in the figure refer to embryonic days. “Years” refer to postnatal years. The timing of the human stages is approximately based on refs 6, 117, 118, 119.
TABLE I. Molecular mechanisms and genes implicated in autism map onto a limited number of steps in neurodevelopment. *We refer readers to https://gene.sfari.org/autdb/Welcome.do for references regarding each gene mutation.