
Figures & data
Figure 1. GRPS embankment: (a) problem geometry and (b) representative unit cell. (c) Substructuring for both CPS and GRPS embankments.
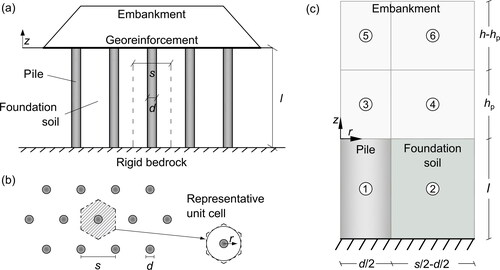
Figure 2. Numerical model and spatial discretization.
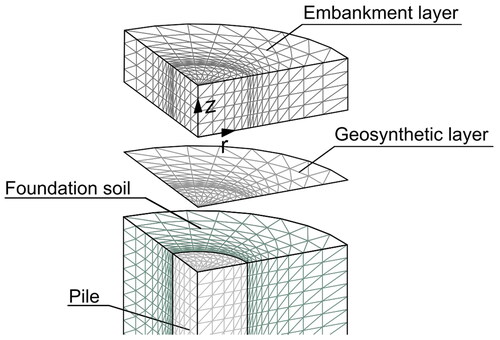
Table 1. Reference case geometry for both GRPS and CPS embankments.
Table 2. Reference case mechanical properties for both GRPS and CPS embankments.
Figure 3. Variation of vertical stress along the radial coordinate for z = 0: (a) GRPS embankment, below the geosynthetic reinforcement and (b) CPS embankment.
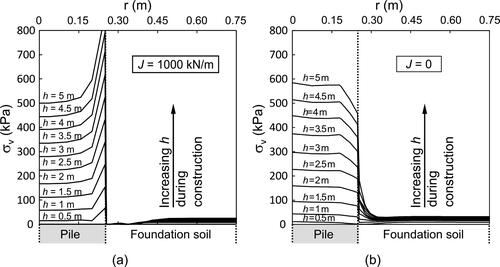
Figure 4. Numerical results of GRPS reference embankment in terms of: (a) vertical stress acting above the membrane and (b) net vertical stress acting on the membrane along the radius for different values of embankment height.
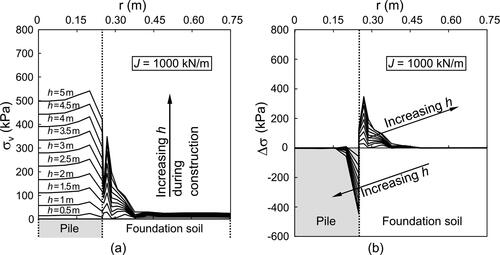
Figure 5. Reinforced reference case: distribution for r = d/2 of vertical stress for different h values.
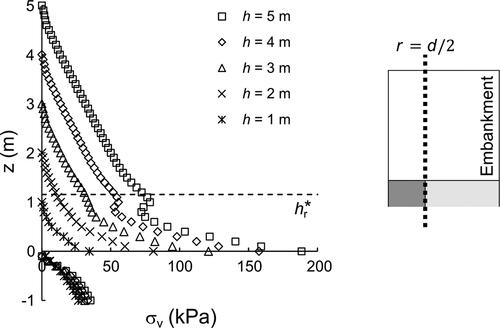
Figure 6. Comparison for the reference case between the current standards and the FD analyses of GRPS embankment in FLAC3D for h = 5 m in terms of both (a) σv acting above the geosynthetic reinforcement and (b) net vertical stress, Δσ, against the radial coordinate.
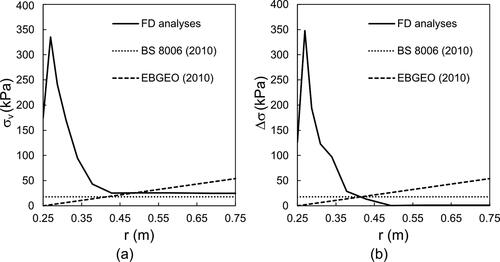
Figure 7. Variation of the tensile force (a) T in the geosynthetic reinforcement and of its (b) vertical and (c) horizontal components along the radius for different embankment height values.
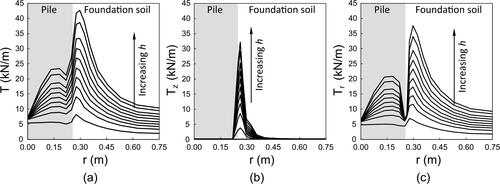
Figure 8. Comparison between different standards and FD analyses results in terms of maximum tensile force in the geosynthetic against height of the embankment.
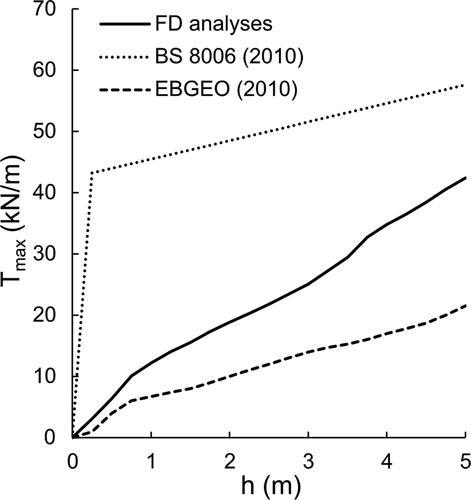
Figure 9. Settlement profile at the embankment base for both (a) the reinforced and (b) the unreinforced reference case.
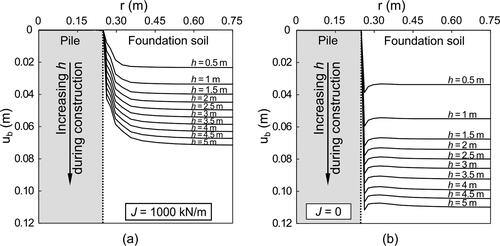
Figure 10. Settlement profile at the embankment top for (a) the reinforced and (b) the unreinforced reference case.
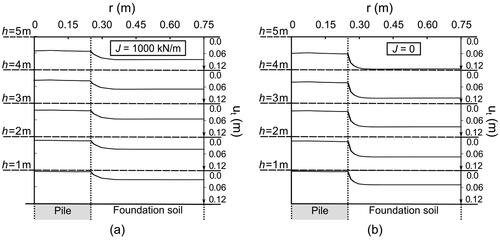
Figure 11. Numerical results of GRPS reference embankment in terms of: profiles of (a) vertical stress and (b) vertical displacement for different values of z; contour plot of both (c) vertical stress and (d) settlements in z = 0.
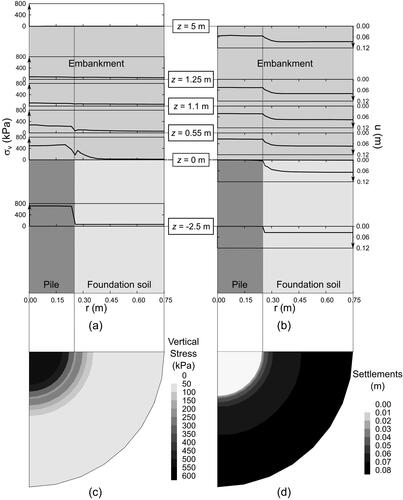
Figure 12. Progressive evolution of deviatoric strains in the GRPS reference embankment during construction.
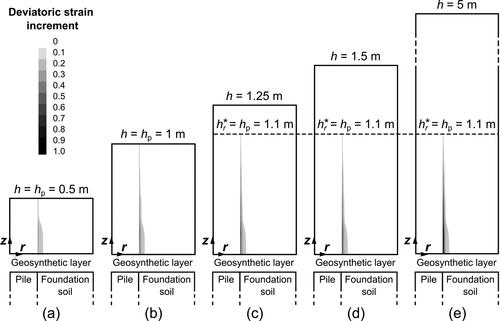
Figure 13. Evolution of the height of the process zone (process height) during construction.
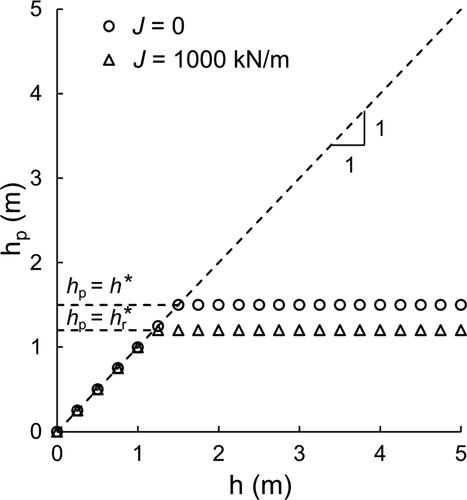
Figure 14. Numerical results of GRPS reference embankment, for h = 5 m, in terms of: (a) contour plot of vertical stresses in subdomain 4 of the embankment, (b) vertical stress profiles for z = 0, z = hr*/2 and z = hr*, (c) contour plot of shear stresses in subdomain 4 of the embankment, (d) shear stress profiles for z = 0, z = hr*/2 and z = hr*.
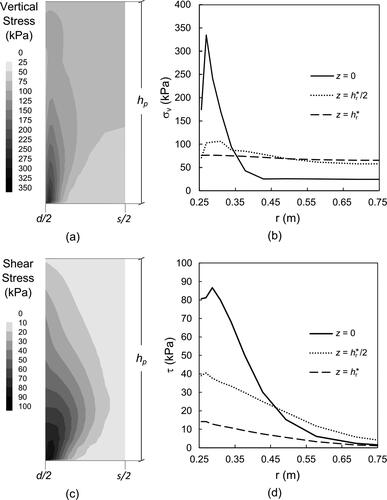
Figure 15. Numerical results of GRPS reference embankment, for h = 5 m, in terms of (a) vertical and horizontal stress; (b) k ratio and (c) tangential stresses within the embankment for r = d/2.
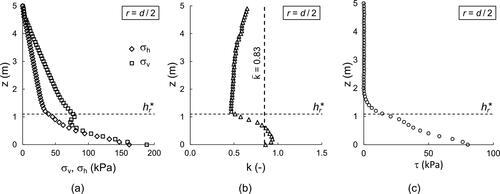
Figure 16. Numerical results of GRPS reference embankment in terms of variation of vertical stresses along z for: a) r = 0, b) r = (s-d)/2 and c) r = s/2.
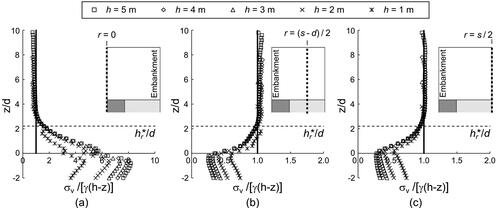
Figure 17. Numerical results of GRPS reference embankment in terms of distribution of normalised tangential stresses within the embankment for r = d/2 during construction (different values of embankment height are considered).
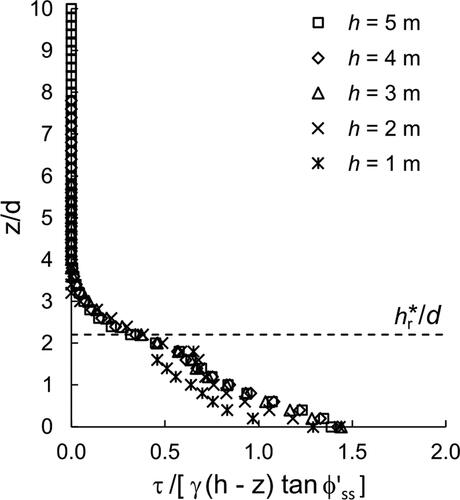
Figure 18. Numerical results for both CPS and GRPS reference embankments in the non-dimensional a) Ut,diff - H, b) Ut,av - H, c) Ub,f - H, d) the - H and
- H and e)
- H planes.
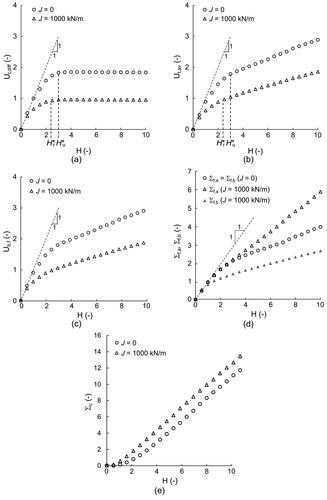
Figure 19. Numerical results for both CPS and GRPS reference embankments in terms of evolution of the increment of (a) differential settlements and (b) average settlements at the top of the embankment.
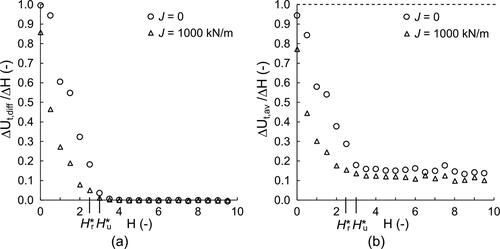
Figure 20. Evolution of non-dimensional maximum tensile force in the geosynthetic reinforcement with a) non-dimensional embankment height and b) non-dimensional average settlement of the membrane, Ub,f.
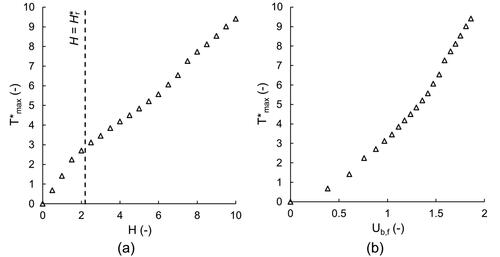
Figure 21. Influence of reinforcement tensile axial stiffness, J, on non-dimensional: both a) differential and b) average settlements and c) maximum tensile force. d) Non-dimenisonal average settlement at the base of the embankment against non-dimensional geosynthetic axial stiffness for H = 10.
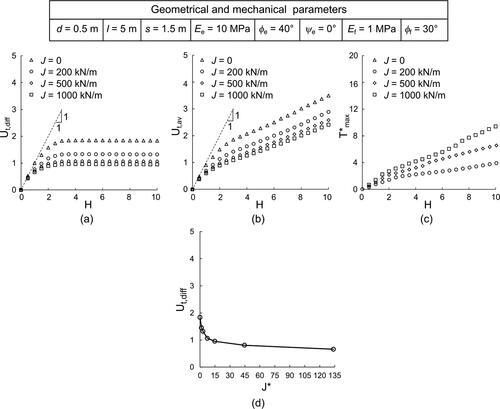
Figure 22. Influence of: embankment deformability on a) Ut,diff, b) Ut,ax, c) T*max; embankment soil friction angle on: d) Ut,diff, e) Ut,ax, f) T*max and embankment soil dilatancy angle on g) Ut,diff, h) Ut,ax, i) T*max.
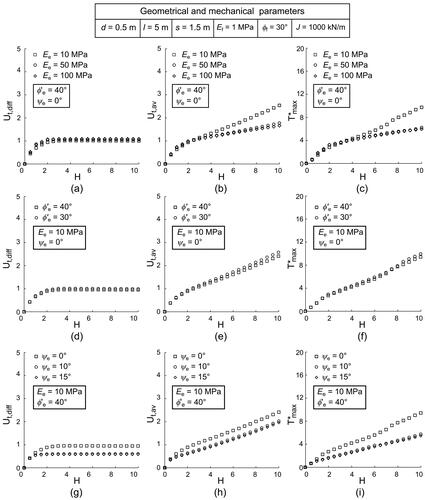
Figure 23. Influence of: foundation soil deformability on a) Ut,diff, b) Ut,ax, c) T*max and foundation soil friction angle on d) Ut,diff, e) Ut,ax, f) T*max.
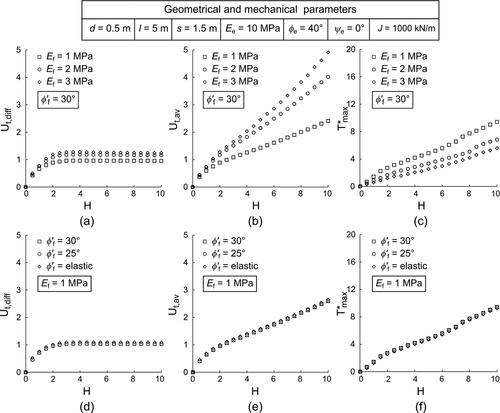
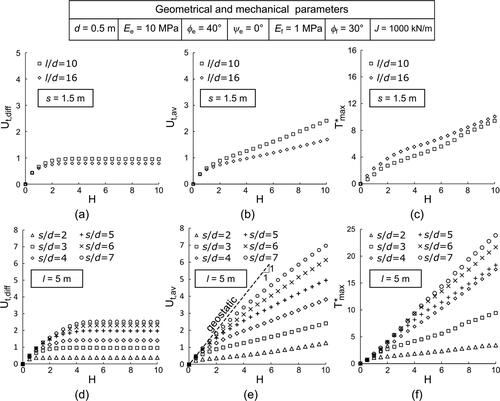
Figure 24. Influence of: foundation soil stratum thickness on a) Ut,diff, b) Ut,ax, c) T*max and influence of spacing on d) Ut,diff, e) Ut,ax, f) T*max.
Data availability statement
Some or all data, models or code that support the findings of this study are available from the corresponding author upon reasonable request.