
Figures & data
Figure 1. SEM micrographs for: (a) grinded fly ash, (b) grinded blast furnace slag, (c) grinded rice husk ash.
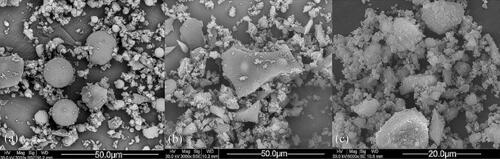
Figure 2. Particle size distribution for the fine and coarse aggregates.
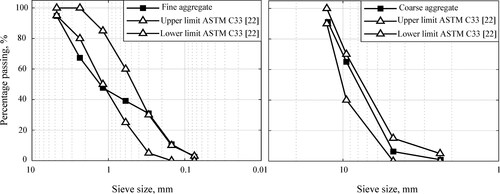
Table 1. Physical properties of fine and coarse aggregates.
Table 2. Chemical composition of raw materials.
Figure 3. X-ray diffraction patterns for raw materials.
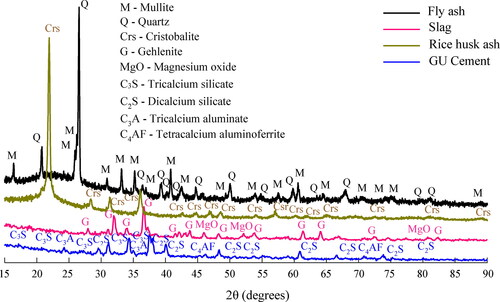
Table 3. Mineralogical composition for raw materials.
Table 4. Proportions of concrete mixtures.
Figure 4. (a) Appearance of cast concrete specimens, (b) typical failure after the compressive test. From left to right: TC, GA and GC concretes.
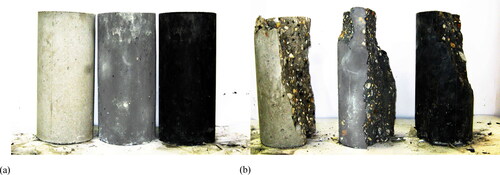
Figure 5. Calorimetric responses for pastes of concrete mixtures: (a) temperature increase vs. time, (b) cumulative heat vs. time, (c) heat flow vs. time (12 h), (d) heat flow vs. time (50 h).
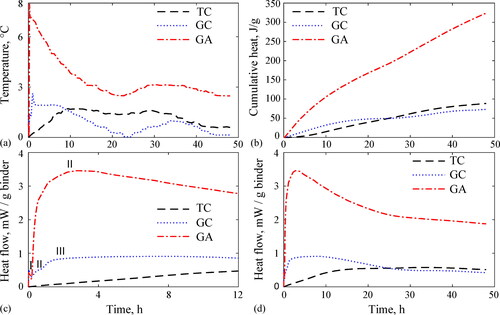
Figure 6. X-ray diffraction patterns for geopolymer pastes from GC and GA concretes.
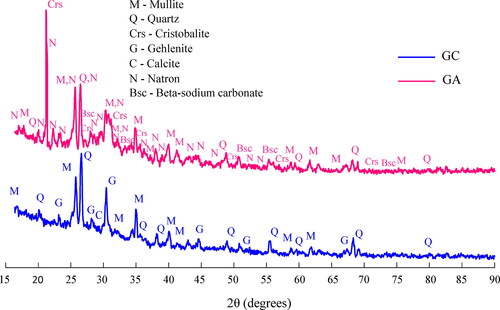
Table 5. Mineralogical composition for pastes from GC and GA concretes.
Figure 7. Results of the concrete mixtures in the fresh state: (a) slump, (b) unit weight, (c) air content.

Figure 8. Flow curves for pastes from concrete mixtures.
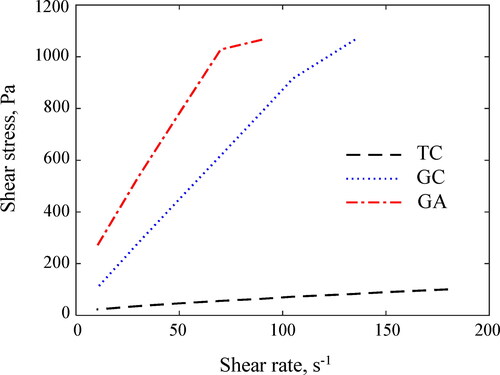
Figure 9. Compressive strength evolution of TC, GC and GA concretes.
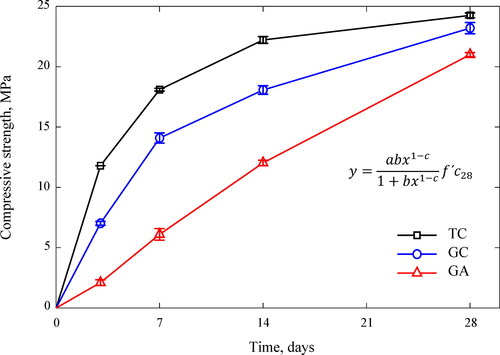
Table 6. Compressive strength of concretes at 28-day age, MPa.
Table 7. Input oxide molar ratios (input atomic ratios) of the GC and GA geopolymer concretes.
Figure 10. Comparison between experimental evolution of compressive strength and theoretical models for: (a) GC concrete, (b) GA concrete.
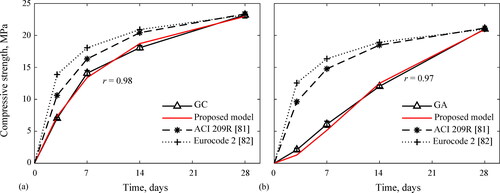
Table 8. Constants used in predicting the compressive strength evolution of geopolymer concretes.
Table 9. Modulus of elasticity of concretes at 28-day age, MPa.
Figure 11. Comparison between experimental and theoretical values of the modulus of elasticity for: (a) Portland cement concrete, (b) fly ash geopolymer concrete, (c) fly ash slag geopolymer concrete, (d) alkali-activated slag concrete.
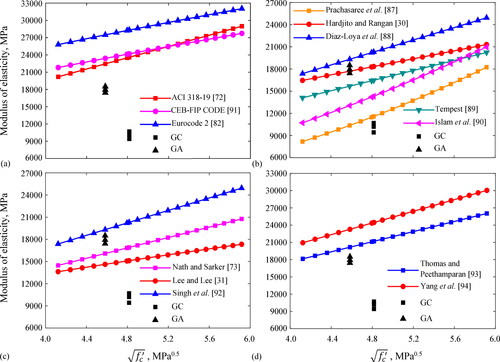
Table 10. Poisson’s ratios of concretes at 28-day age.
Figure 12. Comparison between experimental and theoretical values of splitting tensile capacity for: (a) Portland cement concrete, (b) fly ash geopolymer concrete, (c) fly ash slag geopolymer concrete, (d) alkali-activated slag concrete.
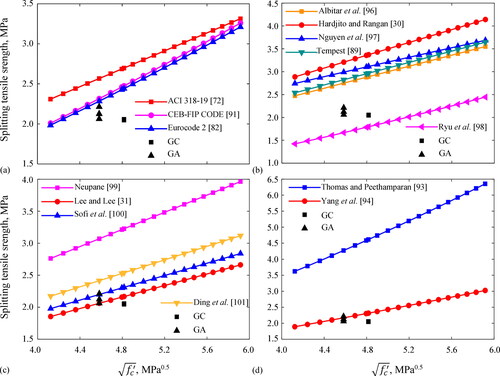
Table 11. Splitting tensile strength of concretes at 28-day age, MPa.
Figure 13. SEM micrographs of pastes from manufactured concretes: (a) TC (50 μm), (b) GC (50 μm), (c) GA (50 μm), (d) TC (10 μm), (e) GC (5 μm), (f) GA (2 μm).
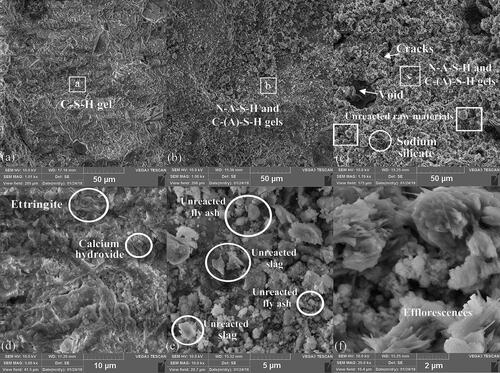
Figure 14. EDS analysis of pastes from manufactured concretes: (a) TC (spot a in GC (spot b in GA (spot c in ).
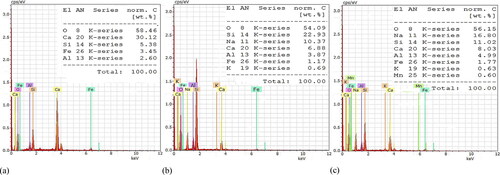
Table A1. Existing models in the literature of modulus of elasticity for different types of concrete.
Table B1. Existing models in the literature of splitting tensile strength for different types of concrete.
Data availability statement
Data available within the article or its supplementary materials.