Figures & data
Table 1: Confounding results on impact of R&D and marketing integration.
Figure 1: Proposed research framework.
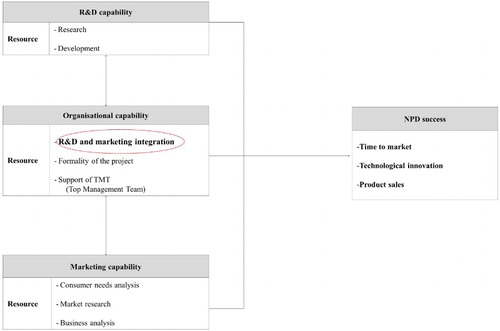
Table 2: Descriptive statistics of variables.
Table 3: LR-test of estimated models.
Table 4: Comparison of AIC and BIC between models.
Table 5: LR-test of parametric linear regression model and nonparametric MARS model.
Table 6: Comparison of adjusted R-square between parametric model and nonparametric MARS model.
Table 7: Regression result: knot configuration and spline coefficients.
Figure 2: Marginal response functions for time to market, technological innovation, and product sales with respect to R&D and marketing integration.
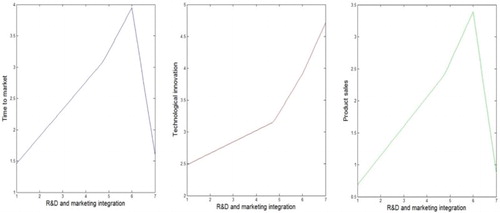
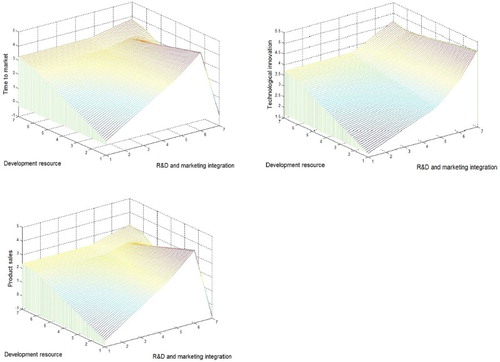
Figure 3: Marginal response surface for ‘Time to market’, ‘Technological innovation’, and ‘Product sales’ with respect to R&D and marketing integration and development resource.