Figures & data
Figure 1. Development of biotechnology (granted patents) in selected countries (regions).
Note: Patents are from eight patent issuing authorities (USPTO, JPO, KIPO, EPO, DPMA, UKIPO, FPO and SIPO).
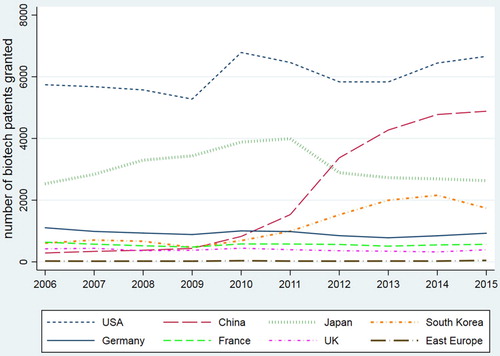
Table 1. Growth rate of total patents and patent intensity in the selected countries/region.
Table 2. Revealed technology advantage of biotech fields.
Table 3. Organizational structure of patent applicants.
Table 4. Pearson correlation coefficients (r) between granted patents and several factors (2006–2015).
Table 5. Pearson correlation coefficients (r) between biotech patents and publications.
Table 6. Shares of knowledge sources for patents granted to Chinese inventors.
Figure 2. Share of local patents cited by Chinese biotech patents.
Note: We take the share in non-SIPO patents as a two-year moving average.
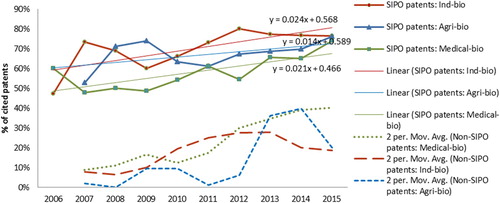
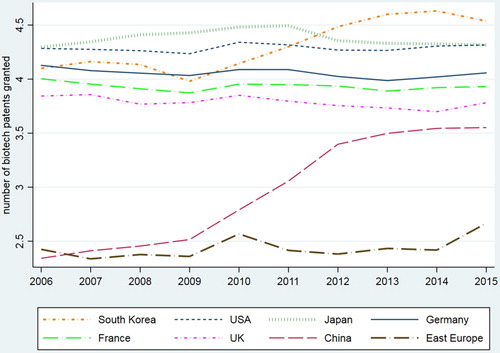
Figure A1. Intensity of biotechnology (log of biotech patents per thousand inhabitants).
Note: Patent intensity is measured by the logarithm of granted patents per thousand inhabitants.