1,488
Views
6
CrossRef citations to date
0
Altmetric
Articles

Transplantation of human adipose-derived stem cells into the urethra ameliorates stress urinary incontinence and blunts the induction of c-Fos immunoreactivities in brain areas related to micturition in female rats

, , , , , , , , & show all
Pages 237-244 | Received 09 Aug 2010, Accepted 16 Aug 2010, Published online: 10 Dec 2010

Figures & data

Figure 1.  Effect of human adipose-derived stem cells (ADSCs) on the abdominal leak point pressure after induction of stress urinary incontinence (SUI). Upper panel: photomicrographs of the abdominal leak point pressure. Lower panel: the mean±SEM of the abdominal leak point pressure in sham-operation (A), SUI-induction (B) and SUI-induction followed by human ADSC injection (C) groups. * represents P<0.05 compared with the sham-operation group and # represents P<0.05 compared with the SUI-induction group.
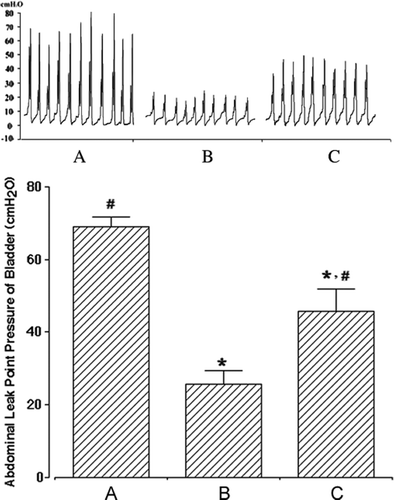
Figure 1.  Effect of human adipose-derived stem cells (ADSCs) on the abdominal leak point pressure after induction of stress urinary incontinence (SUI). Upper panel: photomicrographs of the abdominal leak point pressure. Lower panel: the mean±SEM of the abdominal leak point pressure in sham-operation (A), SUI-induction (B) and SUI-induction followed by human ADSC injection (C) groups. * represents P<0.05 compared with the sham-operation group and # represents P<0.05 compared with the SUI-induction group.

Figure 2.  Expression of α-smooth muscle actin in human adipose-derived stem cells (ADSCs) at 8 weeks after transplantation. Representative fluorescent staining for α-smooth muscle actin (A, green), human ADSCs stained with DiI (B, red) and superimposed images are shown here (C). Original magnification:×100.

Figure 2.  Expression of α-smooth muscle actin in human adipose-derived stem cells (ADSCs) at 8 weeks after transplantation. Representative fluorescent staining for α-smooth muscle actin (A, green), human ADSCs stained with DiI (B, red) and superimposed images are shown here (C). Original magnification:×100.

Figure 3.  Effect of human adipose-derived stem cells (ADSCs) on c-Fos expression in the pontine micturition center (PMC). Upper panels: representative photomicrographs of c-Fos-positive cells in the PMC. The sections were stained for c-Fos-like immunoreactivity (brown) as described in Materials and methods. The scale bar represents 100 µm. Lower panel: the mean number±SEM of c-Fos immunoreactivity in sham-operation (A), SUI-induction (B) and SUI-induction followed by human ADSC injection (C) groups. *represents P<0.05 compared with the sham-operation group and #represents P<0.05 compared with the SUI-induction group.
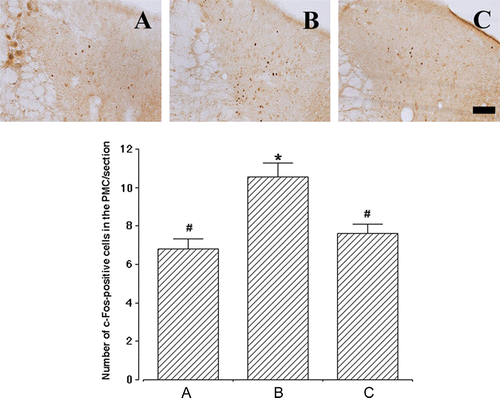
Figure 3.  Effect of human adipose-derived stem cells (ADSCs) on c-Fos expression in the pontine micturition center (PMC). Upper panels: representative photomicrographs of c-Fos-positive cells in the PMC. The sections were stained for c-Fos-like immunoreactivity (brown) as described in Materials and methods. The scale bar represents 100 µm. Lower panel: the mean number±SEM of c-Fos immunoreactivity in sham-operation (A), SUI-induction (B) and SUI-induction followed by human ADSC injection (C) groups. *represents P<0.05 compared with the sham-operation group and #represents P<0.05 compared with the SUI-induction group.
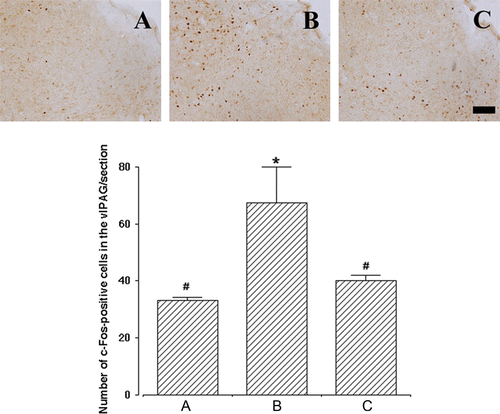
Figure 4.  Effect of human adipose-derived stem cells (ADSCs) on c-Fos expression in the ventrolateral periaqueductal gray (vlPAG). Upper panels: representative photomicrographs of c-Fos-positive cells in the vlPAG. The sections were stained for c-Fos-like immunoreactivity (brown) as described in Materials and methods. The scale bar represents 100 µm. Lower panel: the mean number±SEM of c-Fos immunoreactivity in sham-operation (A), SUI-induction (B) and SUI-induction followed by human ADSC injection (C) groups. *represents P<0.05 compared with the sham-operation group and #represents P<0.05 compared with the SUI-induction group.

Figure 4.  Effect of human adipose-derived stem cells (ADSCs) on c-Fos expression in the ventrolateral periaqueductal gray (vlPAG). Upper panels: representative photomicrographs of c-Fos-positive cells in the vlPAG. The sections were stained for c-Fos-like immunoreactivity (brown) as described in Materials and methods. The scale bar represents 100 µm. Lower panel: the mean number±SEM of c-Fos immunoreactivity in sham-operation (A), SUI-induction (B) and SUI-induction followed by human ADSC injection (C) groups. *represents P<0.05 compared with the sham-operation group and #represents P<0.05 compared with the SUI-induction group.

Reprints and Corporate Permissions

Please note: Selecting permissions does not provide access to the full text of the article, please see our help page How do I view content?

To request a reprint or corporate permissions for this article, please click on the relevant link below:

Academic Permissions

Please note: Selecting permissions does not provide access to the full text of the article, please see our help page How do I view content?

Obtain permissions instantly via Rightslink by clicking on the button below:

If you are unable to obtain permissions via Rightslink, please complete and submit this Permissions form. For more information, please visit our Permissions help page.