643
Views
1
CrossRef citations to date
0
Altmetric
Articles

Low-intensity treadmill exercise and bright light upregulate brain-derived neurotrophic factor expression and intracellular signaling pathway in rat hippocampus and cerebral cortex

, , , , &
Pages 135-142 | Received 03 Dec 2013, Accepted 02 Feb 2014, Published online: 13 Mar 2014

Figures & data

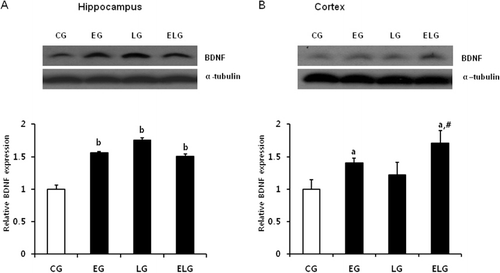
Figure 1. Changes in BDNF protein expression in the hippocampus and cortex after low-intensity treadmill exercise and bright light exposure. Western blots of BDNF proteins from lysates of rat hippocampus (A) and cortex (B) and their quantification. a, p < 0.05, b, p < 0.001 vs. control group and #p < 0.001, vs. exercise and light group. CG, control group; EG, exercise group; LG, light group; ELG, exercise plus light group.
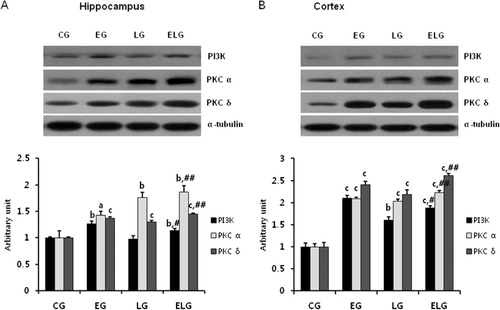
Figure 2. Changes in PI3K, PKCα, and PKCδ protein expression in the hippocampus and cortex after low-intensity treadmill exercise and bright light exposure. Western blots of PI3K, PKCα, and PKCδ proteins from lysates of rat hippocampus (A) and cortex (B) and their quantification. a, p < 0.05, b, p < 0.01, c, p < 0.001 vs. control group, #p < 0.01 vs. light group, and ##p < 0.001 vs. exercise group and light group. CG, control group; EG, exercise group; LG, light group; ELG, exercise plus light group.
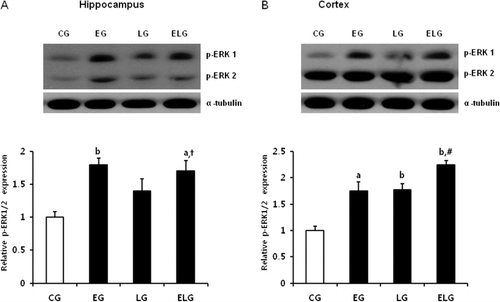
Figure 3. Changes in ERK1/2 protein expression in the hippocampus and cortex after low-intensity treadmill exercise and bright light exposure. Western blots of p-ERK 1/2 proteins from lysates of rat hippocampus (A) and cortex (B) and their quantification. a, p < 0.01, b, p < 0.001 vs. control group and p < 0.001 vs. light group, #p < 0.001 vs. exercise group and light group. CG, control group; EG, exercise group; LG, light group; ELG, exercise plus light group.
Figure 3. Changes in ERK1/2 protein expression in the hippocampus and cortex after low-intensity treadmill exercise and bright light exposure. Western blots of p-ERK 1/2 proteins from lysates of rat hippocampus (A) and cortex (B) and their quantification. a, p < 0.01, b, p < 0.001 vs. control group and †p < 0.001 vs. light group, #p < 0.001 vs. exercise group and light group. CG, control group; EG, exercise group; LG, light group; ELG, exercise plus light group.
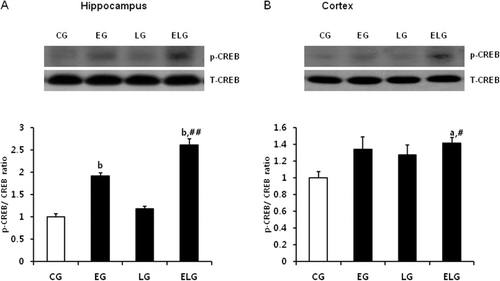
Figure 4. Changes in CREB protein expression in the hippocampus and cortex after low-intensity treadmill exercise and bright light exposure. Western blots of p (phospho)-CREB and T (total)-CREB proteins from lysates of rat hippocampus (A) and cortex (B) and their quantification. a, p < 0.01, b, p < 0.001 vs. control group and #p < 0.01, ##p < 0.001 vs. exercise group and light group. CG, control group; EG, exercise group; LG, light group; ELG, exercise plus light group.
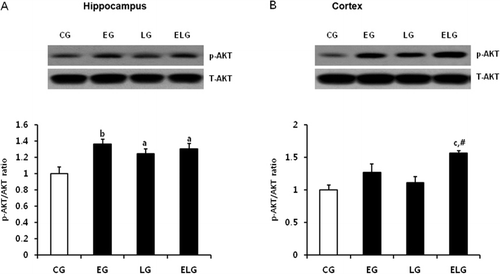
Figure 5. Changes in AKT protein expression in the hippocampus and cortex after low-intensity treadmill exercise and bright light exposure. Western blots of p (phospho)-AKT and T (total)-AKT proteins from lysates of rat hippocampus (A) and cortex (B) and their quantification. a, p < 0.05, b, p < 0.01, c, p < 0.001 vs. control group and #p < 0.01 vs. exercise group and light group. CG, control group; EG, exercise group; LG, light group; ELG, exercise plus light group.
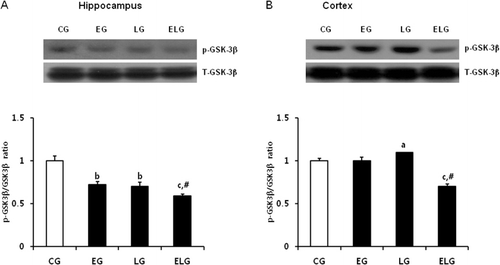
Figure 6. Changes in GSK-3β protein expression in the hippocampus and cortex after low-intensity treadmill exercise and bright light exposure. Western blots of p (phospho)-GSK-3β and T (total)-GSK-3β proteins from lysates of rat hippocampus (A) and cortex (B) and their quantification. a, p < 0.05, b, p < 0.01, c, p < 0.001 vs. control group and #p < 0.001 vs. exercise group and light group. CG, control group; EG, exercise group; LG, light group; ELG, exercise plus light group.
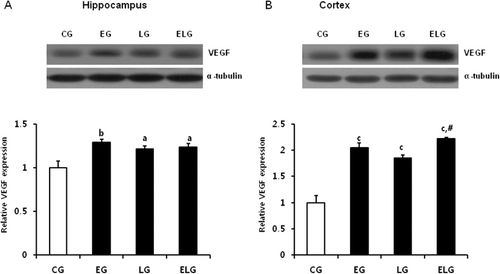
Figure 7. Changes in VEGF protein expression in the hippocampus and cortex after low-intensity treadmill exercise and bright light exposure. Western blots of VEGF proteins from lysates of rat hippocampus (A) and cortex (B) and their quantification. a, p < 0.05, b, p < 0.01, c, p < 0.001 vs. control group and #p <0.001 vs. exercise group and light group. CG, control group; EG, exercise group; LG, light group; ELG, exercise plus light group.

Reprints and Corporate Permissions

Please note: Selecting permissions does not provide access to the full text of the article, please see our help page How do I view content?

To request a reprint or corporate permissions for this article, please click on the relevant link below:

Academic Permissions

Please note: Selecting permissions does not provide access to the full text of the article, please see our help page How do I view content?

Obtain permissions instantly via Rightslink by clicking on the button below:

If you are unable to obtain permissions via Rightslink, please complete and submit this Permissions form. For more information, please visit our Permissions help page.