1,283
Views
1
CrossRef citations to date
0
Altmetric
Articles

Effect of histamine receptors agonists or antagonists administered intracerebroventricularly and intrathecally on the blood glucose level in immobilization stress model

, , , , , & show all
Pages 365-373 | Received 14 May 2015, Accepted 06 Aug 2015, Published online: 05 Nov 2015

Figures & data

Figure 1. Mice were pretreated i.c.v. with of 2-pyridylethylamine (1 µg), cetirizine (0.5 µg), dimaprit (10 µg), ranitidine (20 µg), methylhistamine (5 µg), carcinine (10 µg), VUF 8430 (5µg) and JNJ7777120 (10 µg) for 10 min. Then, mice were enforced into IMO for 30 min and returned to the cage. The blood glucose level was measured at 30, 60 and 120 min after the IMO, (a)–(h), respectively. The blood was collected from tail-vein. The vertical bars indicate the standard error of the mean. **P < .01; compared to IMO + saline group. The number of animals used for each group was 8.
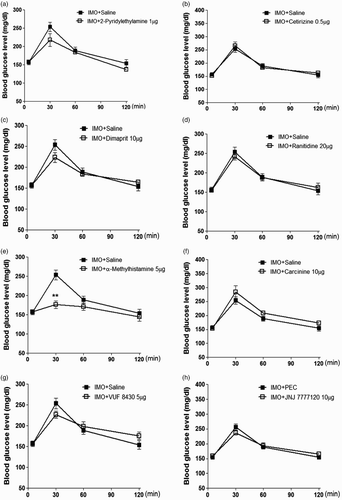
Figure 1. Mice were pretreated i.c.v. with of 2-pyridylethylamine (1 µg), cetirizine (0.5 µg), dimaprit (10 µg), ranitidine (20 µg), methylhistamine (5 µg), carcinine (10 µg), VUF 8430 (5µg) and JNJ7777120 (10 µg) for 10 min. Then, mice were enforced into IMO for 30 min and returned to the cage. The blood glucose level was measured at 30, 60 and 120 min after the IMO, Figure 1(a)–(h), respectively. The blood was collected from tail-vein. The vertical bars indicate the standard error of the mean. **P < .01; compared to IMO + saline group. The number of animals used for each group was 8.

Figure 2. Effect of 2-pyridylethylamine (1 µg), cetirizine (0.5 µg), dimaprit (10 µg), ranitidine (20 µg), methylhistamine (5 µg), carcinine (10 µg), VUF 8430 (5 µg) and JNJ7777120 (10 µg) administered i.t.. Then, the mice were enforced into IMO for 30 min and returned to the cage. The blood glucose level was measured at 30, 60 and 120 min after the IMO, (a)–(h). The blood was collected from tail-vein. The vertical bars indicate the standard error of the mean. *P < .05; compared to saline group, **P < .01, ***P < .005; compared to IMO + saline group. The number of animals used for each group was 8.
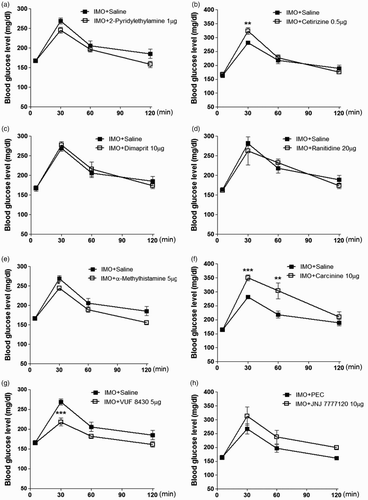
Figure 2. Effect of 2-pyridylethylamine (1 µg), cetirizine (0.5 µg), dimaprit (10 µg), ranitidine (20 µg), methylhistamine (5 µg), carcinine (10 µg), VUF 8430 (5 µg) and JNJ7777120 (10 µg) administered i.t.. Then, the mice were enforced into IMO for 30 min and returned to the cage. The blood glucose level was measured at 30, 60 and 120 min after the IMO, Figure 2(a)–(h). The blood was collected from tail-vein. The vertical bars indicate the standard error of the mean. *P < .05; compared to saline group, **P < .01, ***P < .005; compared to IMO + saline group. The number of animals used for each group was 8.

Figure 3. Effect of α-methylhistamine administered i.c.v. on plasma corticosterone and plasma insulin levels in IMO model. Mice were pretreated i.c.v. with 5 µg of α-methylhistamine for 10 min. Then, mice were enforced into IMO for 30 min and returned to the cage. Plasma corticosterone and insulin levels were also measured at 30 min after IMO ((a) and 3(b), respectively). The blood was collected from tail-vein. The vertical bars indicate the standard error of the mean (*P < .05, **P < .01, ***P < .005; compared to saline + IMO group), compared to IMO + saline group). The number of animals used for each group was 8.
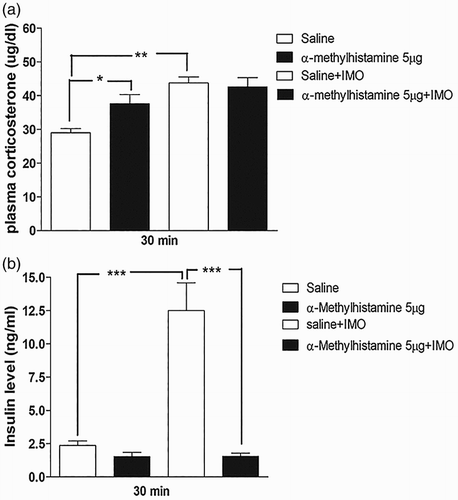
Figure 3. Effect of α-methylhistamine administered i.c.v. on plasma corticosterone and plasma insulin levels in IMO model. Mice were pretreated i.c.v. with 5 µg of α-methylhistamine for 10 min. Then, mice were enforced into IMO for 30 min and returned to the cage. Plasma corticosterone and insulin levels were also measured at 30 min after IMO (Figure 3(a) and 3(b), respectively). The blood was collected from tail-vein. The vertical bars indicate the standard error of the mean (*P < .05, **P < .01, ***P < .005; compared to saline + IMO group), compared to IMO + saline group). The number of animals used for each group was 8.

Figure 4. Effect of α-methylhistamine administered i.t. on plasma corticosterone and plasma insulin levels in the IMO model. Mice were pretreated i.t. with 5 µg of α-methylhistamine for 10 min. Then, the mice were enforced into IMO for 30 min and returned to the cage. Plasma corticosterone and insulin levels were also measured at 30 min after IMO ((a) and 4(b), respectively). The blood was collected from tail-vein. The vertical bars indicate the standard error of the mean (*P < .05, **P < .01, ***P < .005; compared to saline + IMO group). The number of animals used for each group was 8.
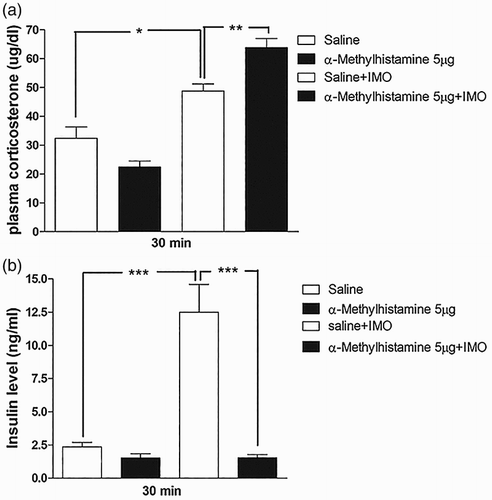
Figure 4. Effect of α-methylhistamine administered i.t. on plasma corticosterone and plasma insulin levels in the IMO model. Mice were pretreated i.t. with 5 µg of α-methylhistamine for 10 min. Then, the mice were enforced into IMO for 30 min and returned to the cage. Plasma corticosterone and insulin levels were also measured at 30 min after IMO (Figure 4(a) and 4(b), respectively). The blood was collected from tail-vein. The vertical bars indicate the standard error of the mean (*P < .05, **P < .01, ***P < .005; compared to saline + IMO group). The number of animals used for each group was 8.

Figure 5. Effect of carcinine administered i.t. on plasma corticosterone and plasma insulin levels in the IMO model. Mice were pretreated i.t. with 10 µg of cetirizine for 10 min. Then, the mice were enforced into IMO for 30 min and returned to the cage. Plasma corticosterone and insulin levels were also measured at 30 min after IMO in carcinine i.t. pretreated mice ((a) and 5(b), respectively). The blood was collected from tail-vein. The vertical bars indicate the standard error of the mean (***P < .005; compared to saline + IMO group). The number of animal used for each group was 8.
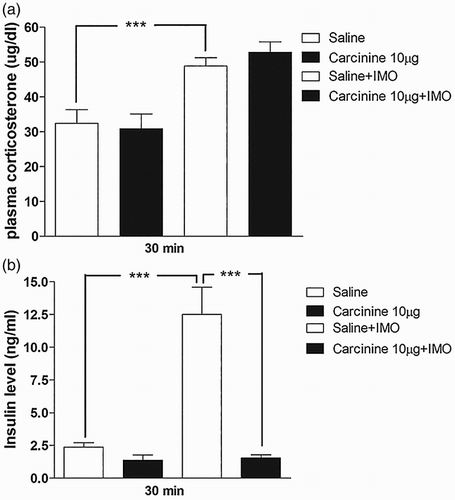
Figure 5. Effect of carcinine administered i.t. on plasma corticosterone and plasma insulin levels in the IMO model. Mice were pretreated i.t. with 10 µg of cetirizine for 10 min. Then, the mice were enforced into IMO for 30 min and returned to the cage. Plasma corticosterone and insulin levels were also measured at 30 min after IMO in carcinine i.t. pretreated mice (Figure 5(a) and 5(b), respectively). The blood was collected from tail-vein. The vertical bars indicate the standard error of the mean (***P < .005; compared to saline + IMO group). The number of animal used for each group was 8.
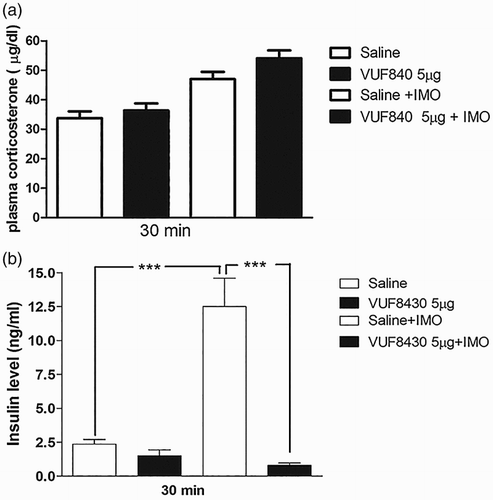
Figure 6. Effect of VUF 8430 administered i.t. on the plasma corticosterone and insulin levels in the IMO model. Mice were pretreated i.t. with 5 µg of VUF 8430 for 10 min. Then, the mice were enforced into IMO for 30 min and returned to the cage. Plasma corticosterone and insulin levels were also measured at 30 min after IMO in VUF 8430 i.t. pretreated mice ((a) and 6(b), respectively). The blood was collected from tail-vein. The vertical bars indicate the standard error of the mean (***P < .005; compared to saline + IMO group). The number of animal used for each group was 8.
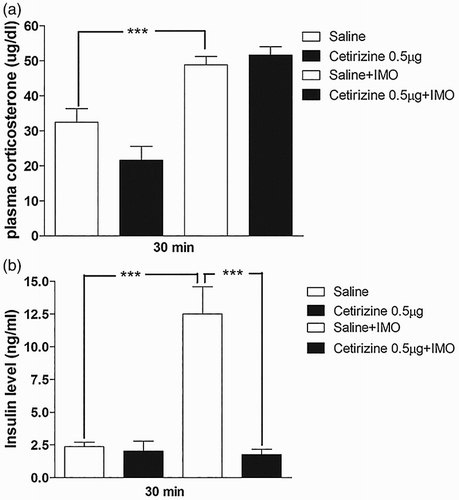
Figure 6. Effect of VUF 8430 administered i.t. on the plasma corticosterone and insulin levels in the IMO model. Mice were pretreated i.t. with 5 µg of VUF 8430 for 10 min. Then, the mice were enforced into IMO for 30 min and returned to the cage. Plasma corticosterone and insulin levels were also measured at 30 min after IMO in VUF 8430 i.t. pretreated mice (Figure 6(a) and 6(b), respectively). The blood was collected from tail-vein. The vertical bars indicate the standard error of the mean (***P < .005; compared to saline + IMO group). The number of animal used for each group was 8.

Figure 7. Effect of cetirizine administered i.t. on plasma corticosterone and insulin in the IMO model. Mice were pretreated i.t. with 0.5 µg of cetirizine for 10 min. Then, the mice were enforced into IMO for 30 min and returned to the cage. Plasma corticosterone and insulin levels were measured at 30 min after IMO in cetirizine i.t. pretreated mice ((a) and 7(b), respectively). The blood was collected from tail-vein. The vertical bars indicate the standard error of the mean (***P < .005; compared to saline + IMO group). The number of animal used for each group was 8.

Figure 7. Effect of cetirizine administered i.t. on plasma corticosterone and insulin in the IMO model. Mice were pretreated i.t. with 0.5 µg of cetirizine for 10 min. Then, the mice were enforced into IMO for 30 min and returned to the cage. Plasma corticosterone and insulin levels were measured at 30 min after IMO in cetirizine i.t. pretreated mice (Figure 7(a) and 7(b), respectively). The blood was collected from tail-vein. The vertical bars indicate the standard error of the mean (***P < .005; compared to saline + IMO group). The number of animal used for each group was 8.

Reprints and Corporate Permissions

Please note: Selecting permissions does not provide access to the full text of the article, please see our help page How do I view content?

To request a reprint or corporate permissions for this article, please click on the relevant link below:

Academic Permissions

Please note: Selecting permissions does not provide access to the full text of the article, please see our help page How do I view content?

Obtain permissions instantly via Rightslink by clicking on the button below:

If you are unable to obtain permissions via Rightslink, please complete and submit this Permissions form. For more information, please visit our Permissions help page.