Figures & data
Figure 1. Phylogenetic analyses of Pajα3, Pajα10, Pajα11, Pajα12, and Pajβ1 compared with subunits from other insect species. The diagram was generated by the neighbor-joining method with MEGA 5.1 using 1000 bootstrap replicates. Species names and GenBank Accession numbers are shown. Pajα3, Pajα10–12, and Pajβ1 are indicated by arrows.
Figure 2. Deduced protein sequences of P. japonica α3 and β1 nAChR subunits from insect species. Conserved amino acids are indicated (black columns). Signal peptide sequences and transmembrane domains (TM boxes) were predicted by CBS Prediction server analysis. The positions of the loops (LpA–F), the two cysteines forming the Cys-loop, and an RRR motif are indicated. A GEK motif is boxed, and the Cys-pair, characteristic of α subunits, is marked by an arrow. GenBank accession numbers: T. castaneum Tcasα3 (ABS86904), Tcasα4 (ABS86906), Tcasβ1 (ABS86916); A. mellifera Amelα3 (AAY87891), Amelα4 (AAY87892), Amelβ1 (AAY87897); B. mori Bmorα3 (ABV72685), Bmorα4 (ABV72686), Bmorβ1 (ABV72692); P. japonica Pajα3 (KC153234), Pajβ1 (KC153238).
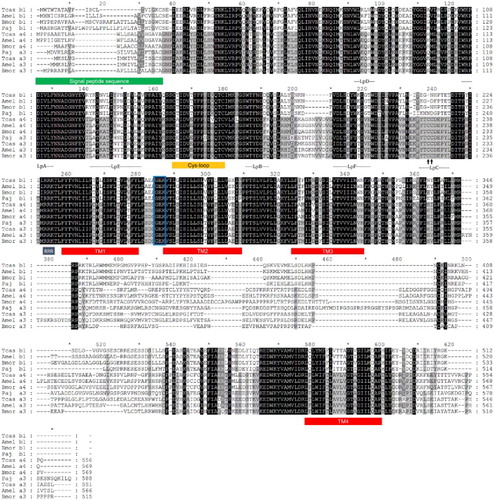
Figure 3. Deduced protein sequences of P. japonica α10–12 and nAChR subunits from insect species. Conserved amino acids are indicated (black columns). Signal peptide sequences (underlined) and transmembrane domains (TM boxes) were predicted by CBS Prediction server analysis. The positions of the loops (LpA–F), the two cysteines forming a Cys-loop, and an RRR motif are indicated. A GEK motif is boxed, and the Cys-pair, characteristic of α subunits, is marked by an arrow. GenBank accession numbers: T. castaneum Tcasα9 (ABS86913), Tcasα10 (ABS86914); D. melanogaster Dmelβ3 (AAF89090); A. gambiae Agamα9 (AAU12513); A. mellifera Amelα9 (AAY87896), Amelβ2 (NP_001091699); B. mori Bmorα9 (ABV72691), Bmorβ2 (ABV72693), Bmorβ3 (ABV72694); P. japonica Pajα10 (KC153235), Pajα11 (KC153236), Pajα12 (KC153237).
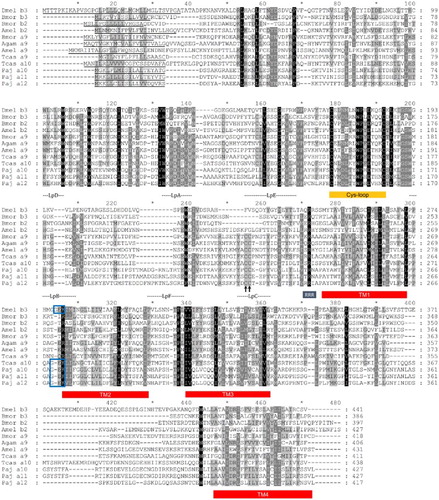
Figure 4. Schematic representation of the protein structures of Pajα3, Pajα10–12, and Pajα1. The boxes represent domains or motifs, and the ovals indicate loops. The signal peptide sequence (SP box), Cys-loop (Cys-loop box), and transmembrane domains (TM boxes) are indicated. (a) Pajα3 has three splicing variants with differences between TM3 and TM4. Amelα3 and Amelα6 also have splicing variants. Splicing variant amino sequences were shown. Putavie phosphorylation sites were indicated by black boxes. (b) Compared with the other subunits, Pajα10–12 have a small intercellular loop. (c) Loop C for Ach binding is lacking in Pajα1.
Figure 5. Expression of Pajα3, Pajα10–12, and Pajβ1 in various tissues. (a) End-point RT-PCR was performed (30 amplification cycles), and the products were separated in 1.5% agarose gels. The 18S rRNA was used as a control. (M, size marker; BR, brain; AG, abdominal ganglion; TG, thoracic ganglion; SG/XO, sinus gland X-organ; GO, gonad; HP, hepatopancreas; GI, gill; HG, hindgut; EX, tail muscle; EP, epidermis). (b) Relative copy number of five nAChR subunits among neuronal tissues from P. japonica. Data were normalized to the copy number of 18S rRNA. Statistical significance was accepted only when P < 0.05. (BR, brain; S/X, sinus gland X-organ; AG, abdominal ganglion.)
Figure 6. Expression studies in which cDNA-derived cRNA was injected into the cytoplasm of Xenopus laevis oocytes. (a) Co-injection of Rα4 + Rβ2 (control) and (b) Rα4 + Pajβ1 (sample). The peak of the ACh (100 μM)-gated current response is shown.