Figures & data
Table 1. Fold changes for 18 common DEGs between MPP+-treated SH-SY5Y cells with and without APO. DEGs of SH-SY5Y cells treated with MPP+ alone were obtained from the study of Choi et al. (Citation2014).
Table 2. Enriched GO terms in DEGs obtained from MPP+-treated SH-SY5Y cells with APO. GO terms are ranked by adjusted p-value and the cut-off for the adjusted p-value was .01.
Table 3. Enriched KEGG pathways in DEGs of MPP+-treated SH-SY5Y cells, with and without APO. GO terms are ranked by adjusted p-value and the cut-off for the adjusted p-value was .05.
Figure 2. DEGs in the HIF-1 signaling pathway for MPP+-treated SH-SY5Y cells with APO. Scale bar at the top left represents the log2 fold change.
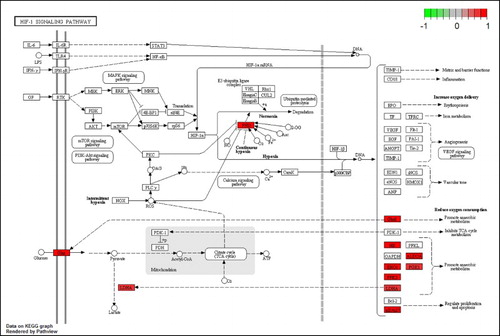
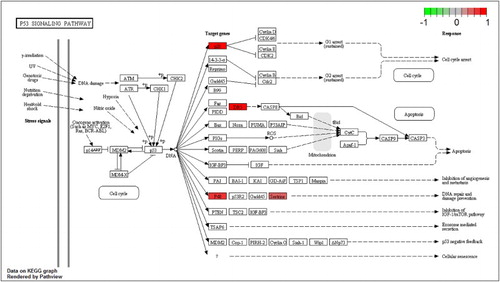
Figure 3. P53 signaling pathway for MPP+-treated SH-SY5Y cells with APO. Scale bar at the top left represents the log2 fold change.