Figures & data
Table 1. The primers for q-PCR.
Figure 1. Starvation induces autophagy in MDA-MB-231 and MCF-7 cells. Both cell lines were treated with EBSS for 0 h, 2 h, 4 h, 6 h and 8 h. (a,c) The protein expression levels of LC3B and p62 in the both treated cells were analyzed with immunoblotting. β-actin was used as an internal control. (b,d) Quantification of the LC3-II protein expression level in the both treated cells. *p < .05 and **p < .01 versus the control were considered significant. (e) Representative electron micrographs for both types of cells. MDA-MB-231 and MCF-3 cells were treated with EBSS for 4 h and 8 h, respectively. Untreated cells were used as a control. Red arrows refer to autophagy vacuoles. Scale bars = 1 μm.
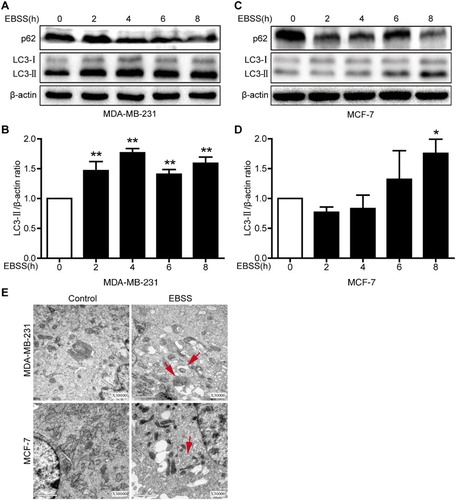
Figure 2. Confocal microscopy images of LC3B in MDA-MB-231 and MCF-7 cells. MDA-MB-231 cells were treated with EBSS for 4 h and MCF-7 cells for 8 h, and were analyzed with confocal microscopy. Cells were stained with antibodies against LC3B (green), nuclei were stained blue with Hoechst 33342. Scale bars = 20 μm.
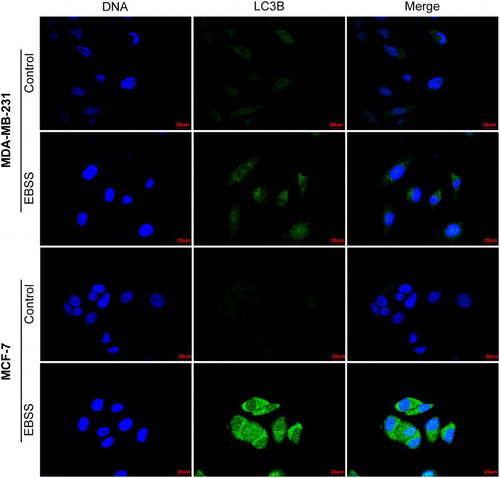
Figure 3. Effect of starvation on the ATG genes mRNA expression level in MDA-MB-231 and MCF-7 cells. The cells were treated with as described above. Untreated cells were used as a control. (a) The mRNA expression levels of the autophagosome initiation-related genes ULK1 and ATG13 in the both treated cell lines. (b) The mRNA expression levels of the nucleation-related genes ATG14, VPS15, VPS34 and BECN1 in the both treated cell lines. (c) The mRNA expression levels of the elongation-related genes ATG4A and ATG7 in the both treated cell lines. (d) The mRNA expression levels of the elongation-related genes ATG5, ATG10 and ATG16L1 in the both treated cell lines. (e) The mRNA expression levels of the degradation cycling-related genes ATG2A and ATG9A in the both treated cell lines. *p < .05 and **p < .01 versus the control were considered significant.
Figure 4. Effect of starvation on the mRNA expression levels of autophagy signaling pathway-related genes in MDA-MB-231 and MCF-7 cells. Both types of cells were treated as described above. (a,b) The mRNA expression levels of the autophagy signaling pathway-related genes SESN1, PTEN, mTOR, EPG5, TSC1, AKT, LKB1, FOXO1, LMNA, AMBRA1 and DRAM1 in the both treated cell lines. *p < .05 and **p < .01 versus the control were considered significant.