Figures & data
Table 1. Primer sequences, PCR product size and annealing temperature used for RQ-TRAP and RT-PCR.
Figure 1. Change in PDT in untreated control (▪) and 1 μM SMA-treated (▪) A-549, MDA-MB-231 and U87-MG cancer cells. Asterisks (*) indicates significant (P < .05) difference between untreated control and SMA-treated cell lines, respectively.
Figure 2. A, Level of telomerase activity analyzed by RQ-TRAP assay in untreated control (▪) and 1 μM SMA-treated (▪) A-549, MDA-MB-231 and U87-MG cancer cells. B, Expression level of TERT and TERC transcripts related with telomerase activity in untreated control (▪) and 1 μM SMA-treated (▪) A-549, MDA-MB-231 and U87-MG cancer cells. Asterisks (*) indicates significant (P < .05) difference between untreated control and SMA-treated cell lines, respectively.
Figure 3. A, Telomere length in untreated control and 1 μM SMA-treated A-549, MDA-MB-231 and U87-MG cancer cells. A, Range of telomere length in normal fibroblasts as control cells. Lane 1: passage 15; Lane 2: passage 10; Lane 3: passage 5. B, Mean (±SEM) Telomere length in 1 μM SMA-treated A-549, MDA-MB-231 and U87-MG cancer cells. Lane 1: Negative control; Lane 2: positive control with mean 10.2 kbp telomere length. Lane 3: untreated A-549 cells; Lane 4: 1 μM SMA-treated A-549 cells; Lane 5: untreated MDA-MB-231 cells; Lane 6: 1 μM SMA-treated MDA-MB-231 cells; Lane 7: untreated U87-MG cells; Lane 8: 1 μM SMA-treated A U87-MG cells. C, Mean (±SEM) telomere length in untreated control (▪) and 1 μM SMA-treated (▪) A-549, MDA-MB-231 and U87-MG cancer cells with three replicates. Asterisks (*) indicates significant (P < .05) difference between untreated control and SMA-treated cell lines, respectively.
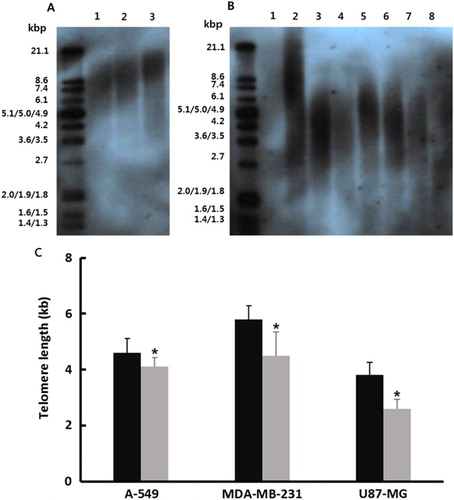
Figure 4. Change in cell morphology and senescence-associated-β-galactosidase activity in untreated control (A, B and C) and 1 μM SMA-treated (D, E and F) A-549, MDA-MB-231 and U87-MG cancer cells A-549, MDA-MB-231 and U87-MG cancer cells up to 2 weeks (×100). Cell changes, such as enlarged and flattened size, and star-shape, were frequently observed by SMA treatment. And a higher activity of senescence-associated-β-galactosidase stained with blue color were observed in cells treated with SMA. Scale bars: 50 μm.
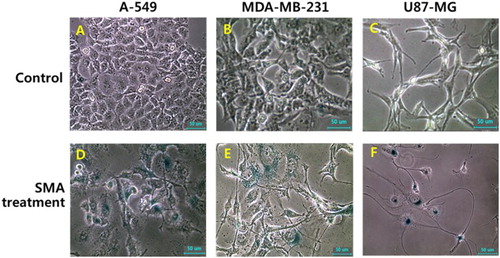
Figure 5. Morphological evaluation of cellular apoptosis and differentiation in 1 μM SMA-treated A-549 (A), U87-MG (B) and MDA-MB-231 (C and D) cancer cells. The fragmented nuclei (arrow) displayed in apoptotic cells were observed by Wright-Giemsa staining, compared with normal (double arrow) nuclei. Further, lipid droplets (dotted arrow)-like morphological alternations under light microscope (C) were observed by 1 μM SMA treatment and the droplets were stained with Oil red O solution (D). (E) Frequency of apoptotic cells with DNA fragmentation in untreated control (▪) and 1 μM SMA-treated (▪) A-549, MDA-MB-231 and U87-MG cancer cells. Asterisks (*) indicates significant (P < .05) difference between untreated control and SMA-treated cell lines, respectively.
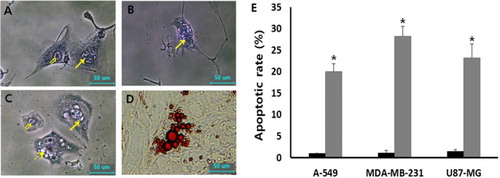
Figure 6. Expression level of transcripts related with intrinsic apoptosis and stress by real-time RT-PCR in untreated control (▪) and 1 μM SMA-treated (▪) A-549, MDA-MB-231 and U87-MG cancer cells. Asterisks (*) indicates significant (P < .05) difference between untreated control and SMA-treated cell lines, respectively.