Figures & data
Figure 1. Morphological analysis of rat-derived primary hepatocytes (PHs). (A) Cultured PHs formed a single monolayer in 2-D culture. Scale bar = 200 µm. (B) In 3-D culture, PHs formed spheroids with time i.e. from days 0 (a, Scale bar = 500 µm) to 7 (b, Scale bar = 200 µm) with continuous (C) decrease in diameter from days 1–7 (Triplicate).
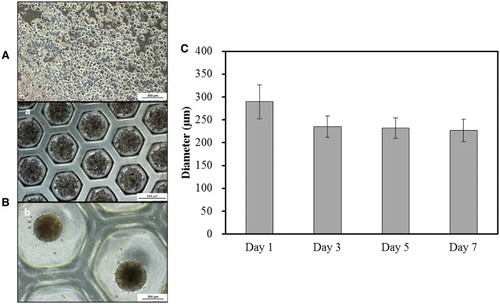
Table 1. Table of primers used in RT-qPCR.
Figure 2. RT-qPCR of hepatocyte-specific markers (A) Alb, (B) Tf, (C) Afp, and xenobiotic-metabolizing enzyme (Cyp3a) in control (day 0) and 2-D and 3-D culture systems on day 7. Gapdh served as the internal control. Letters ‘a,’ ‘b,’ and ‘c’ denote significant difference (p < 0.05) between control and PHs. All experiments were performed in triplicate.
Figure 3. RT-qPCR of apoptotic markers (A) Bax and (B) Bcl2 in control (day 0) and 2-D and 3-D culture systems on day 7. Letters ‘a,’ ‘b,’ and ‘c’ denote significant difference (p < 0.05) between control and PHs. All experiments were performed in five replicates.
Figure 4. Immunofluorescence analysis of ALB, AAT, and TF in (A) 2-D- and (B) 3-D-cultured PHs. Green and blue (DAPI) fluorescence implied positive reactions for each protein and nucleic acid in counterstaining, respectively. Scale bars = 100 µm.
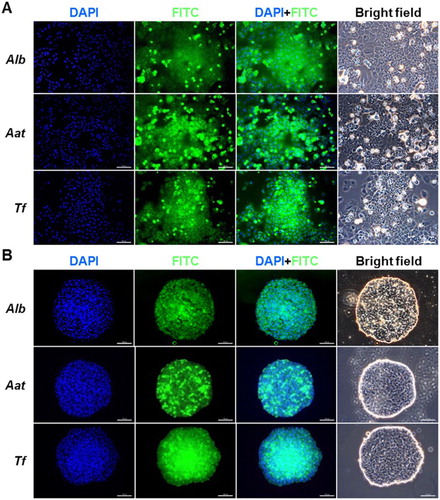
Figure 5. Double-immunofluorescence staining of rat PHs after 2 and 7 days of culture. A and 5B show the co-expression of CYP3A1 (red) and Albumin (green) in monolayer-cultured PHs after 2 and 7 days, respectively. Figures 5C and 5D show the co-expression of CYP3A1 (red) and Albumin (green) in 3-D-cultured PHs after 2 and 7 days, respectively. Blue stain (DAPI) indicates nuclear staining. Scale bar = 100 µm.
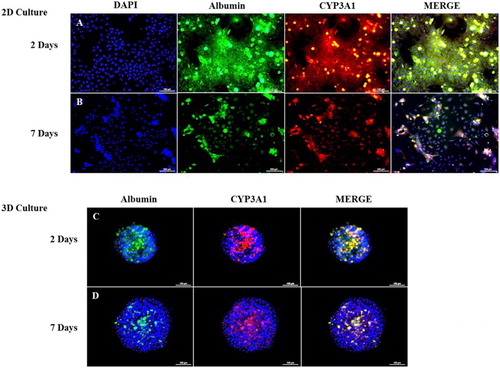
Figure 6 . Gene expression analysis of xenobiotic-metabolizing enzymes. (A,a) Cyp1a expression in control and 3-MC-induced PHs after 48 and 72 h, respectively. (A,b) Cyp3a expression in control and Dexamethasone-induced PHs after 48 and 72 h, respectively. Figures B,a and B, b show the gel images of PCR products. Gapdh served as the internal control. Letters ‘a,’ ‘b,’ ‘c,’ ‘d,’ ‘e,’ ‘f,’ and ‘g’ denote significant difference (p < 0.05) between control and induced PHs. All experiments were performed in five replicates.