Figures & data
Figure 1. Effect of ethylparaben on cell morphology and viability of BeWo cells. (A) BeWo cell viability was measured using the MTS assay. Cells were treated with 0.1–10 mM of ethylparaben for 24 or 48 h. Data are presented as the percentage of the values obtained for the untreated cells used as the control. (B) Cell morphology was observed using phase-contrast microscopy at the indicated time points, for various concentrations of ethylparaben. (C) Cell viability was analyzed using the live/dead assay. Cells were stained with two dyes (Calcein-AM, 0.3 μM; EthD-1, 3 μM) for 30 min at room temperature (approximately 25°C) and stained cells were detected by fluorescence microscopy. Images represent three independent experiments. Scale bars represent 200 μm.
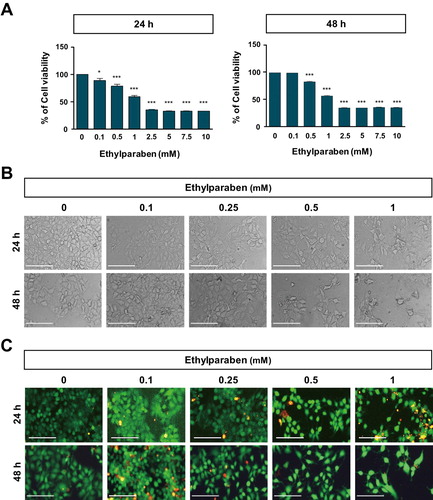
Figure 2. Changes in BeWo cell cycle upon treatment with ethylparaben. BeWo cells were incubated with 0.1–10 mM of ethylparaben for 24 or 48 h. Then, cells were fixed with 70% EtOH for 1 h at 4°C for flow cytometry analysis. The cell cycle was analyzed using FACS using propidium iodide (PI) staining, as described in Materials and methods (SD 2). Data are presented as the percentage of cells in the sub-G1, G0/G1, S, and G2/M phases and are presented as mean ± S.E.M. of three independent experiments (n = 6) measured in triplicate.
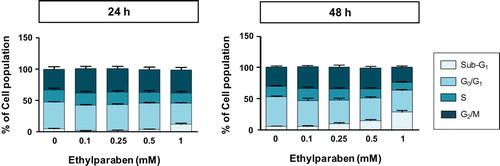
Figure 3. Expression of Cyclin B1 was increased upon ethylparaben treatment in BeWo cells. To assess the effect of ethylparaben treatment on the protein expression level of Cyclin B1, cells were treated with 0.1–1 mM of ethylparaben for 24 or 48 h. Cells were, then, fixed with 1% PFA and were stained with an antibody against Cyclin B1 (upper panel). Data are expressed as the percentage of Cyclin B1 positive cells (lower panel). Data represent the mean ± S.E.M. of three independent experiments (n = 6) measured in triplicate (***, p < .001 compared with cells treated with 0.6% EtOH as a negative control).
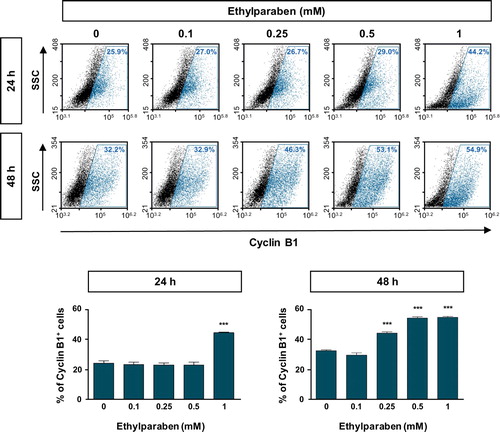
Figure 4. Ethylparaben treatment reduced the expression of Cyclin D1 protein in BeWo cells. The effect of ethylparaben treatment on the protein expression level of Cyclin D1 was analyzed using flow cytometry. BeWo cells were treated with 0.1–1 mM of ethylparaben for 24 or 48 h. Cells were fixed with 1% PFA and were stained with the antibody against Cyclin D1 (upper panel). Data are expressed as the percentage of Cyclin D1 positive cells (lower panel). Data represent the mean ± S.E.M. of three independent experiments (n = 6) measured in triplicate (*, p < .05; **, p < .01; ***, p < .001 compared with cells treated with 0.6% EtOH as a negative control).
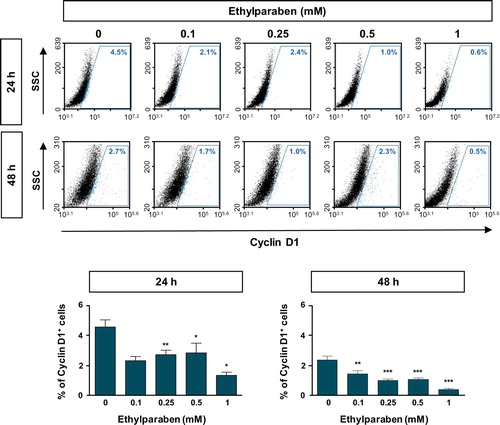
Figure 5. Ethylparaben treatment induced apoptotic cell death in BeWo cells. Cells were incubated with 0.1–1 mM of ethylparaben for 24 or 48 h. Then, cells were stained with Annexin V-FITC and propidium iodide (PI). The proportion of apoptotic cells was assessed using flow cytometry analysis (upper panel). The scatter plots represent PI (y-axis) vs. Annexin V-FITC (x-axis) stained cells. Values express the percentage of cells at the live, early-, late-apoptosis and necrosis stages and represent the mean ± S.E.M. of three independent experiments (n = 6) measured in triplicate (lower panel).
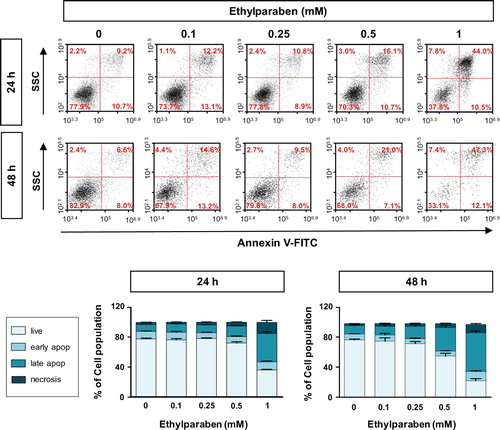
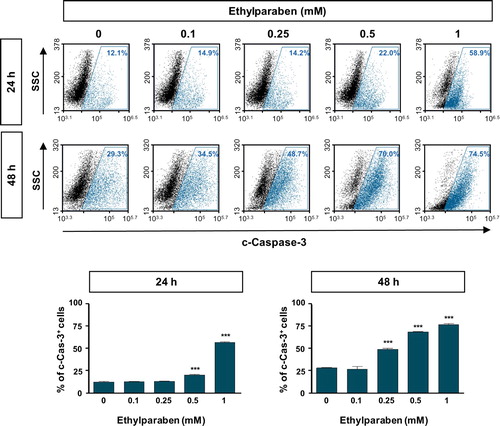
Figure 6. Cleaved Caspase-3 level was increased by ethylparaben treatment in BeWo cells. Functional Caspase-3 level after treatment with ethylparaben was analyzed by the detection of cleaved forms of Caspase-3 using flow cytometry. After treatment with 0.1–1 mM of ethylparaben for 24 or 48 h, BeWo cells were fixed with 1% PFA and stained with the antibody against cleaved-Caspase-3 (c-Caspase-3; upper panel). Data are expressed as the percentage of c-Caspase-3 positive cells (lower panel). Data represent the mean ± S.E.M. of three independent experiments (n = 6) measured in triplicate (***, p < .001 compared with cells treated with 0.6% EtOH as a negative control).