Figures & data
Figure 1. Analysis of morphological changes and cytotoxicity against PGZ by MTT assay in A-549 cancer (dotted line) and MRC-5 fibroblasts (solid line). A: Changes of cell morphology in untreated control A549 cancer cells (a), and 50 μM PGZ-treated A549 cancer cells for 1 week (b) and 3 weeks (c). Changes of cell morphology was not observed in untreated control (d) and 50 μM PGZ-treated MRC-5 fibroblasts (e) for 1 weeks. Morphological change with adiposome vesicles was also observed in 50 μM PGZ-treated 3T3-L1 pre-adipocytes (f) for 1 week. B: Inhibition curves of cell growth by MTT assay in A549 cancer cells and MRC-5 fibroblasts. a, b and c indicate different groups which are significantly different each other (p < .05, one-way ANOVA).
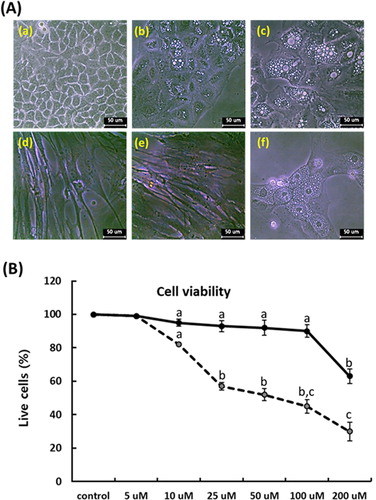
Figure 2. Analysis of cell growth by PDT (A) and wound healing assay (B and C) in A549 cancer cells treated with 50 μM PGZ. A: Weekly analysis of cell growth by PDT in A549 cancer cells treated with 50 μM PGZ up to 4 weeks. B: Cell number migrated into one square (250 μm2) in 50 μM PGZ-treated A549 cancer cells for up to 4 weeks C: Analysis of cell migration by wound healing assay in untreated control A549 cells after scratch (a), untreated control A549 cells at 48 h after scratch (b) and A549 cells treated with 50 μM PGZ for 4 weeks at 48 h after scratch (c). a, b, c, d and e indicate different groups which are significantly different each other (p < .05, one-way ANOVA).
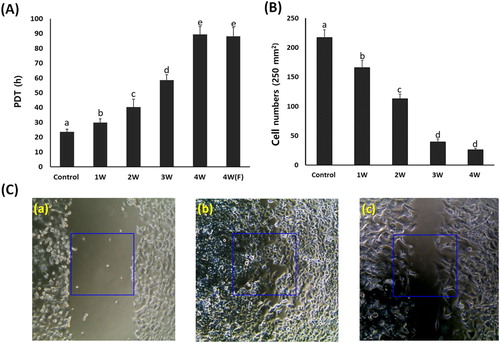
Figure 3. A: Analysis of cell volume in untreated control A549 cells (a) and A549 cells treated with 50 μM PGZ up to 4 weeks (b). B: Weekly analysis of cell volume in A549 cancer cells treated with 50 μM PGZ up to 4 weeks. C: Weekly analysis of glucose uptake in A549 cancer cells treated with 50 μM PGZ up to 4 weeks. a, b, c and d indicate different groups which are significantly different each other (p < .05, one-way ANOVA).
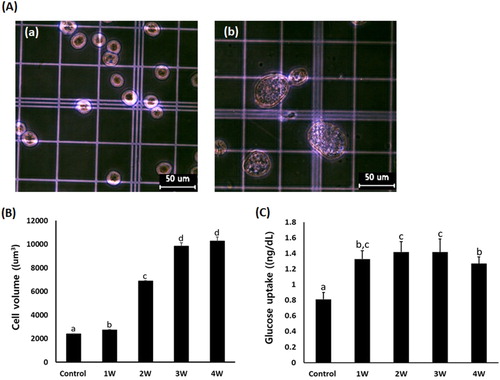
Figure 4. Analysis of cell differentiation into adipocytes in A549 cancer cells treated with 50 μM PGZ up to 4 weeks. A: Adiposomes were stained with oil red O solution in untreated control (a) and 50 μM PGZ-treated (b) A549 cancer cells. Accumulation of intracellular lipids in the cells were stained to red spots. B: Expression level of GLUT4 (▪) and PPARγ (▪) by RT-PCR in A549 cancer cells treated with 50 μM PGZ up to 4 weeks. a, b and c indicate different groups which are significantly different each other (p < .05, one-way ANOVA).
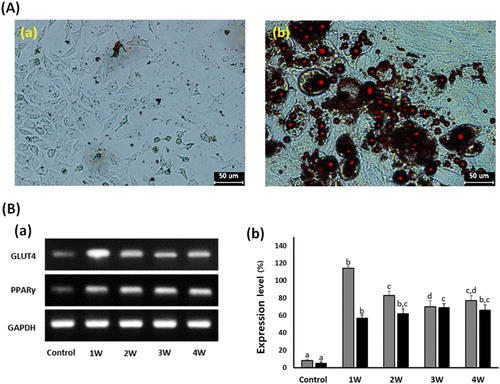
Figure 5. A: Analysis of senescence-associated-β-galactosidase activity in untreated control (a) and 50 μM PGZ-treated (b) A549 cancer cells up to weeks. After PGZ treatment, the morphological change of the cell to enlarged and flattened shape, and high activity of senescence-associated-β-galactosidase stained with blue color were displayed in A549 cancer cells treated with PGZ. B: Telomerase activity analyzed by RQ-TRAP in A549 cancer cells treated with 50 μM PGZ up to 4 weeks. a, b, c, d and e indicate different groups which are significantly different each other (p < .05, one-way ANOVA).
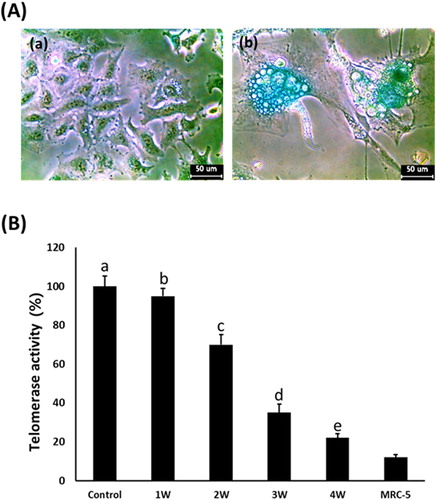
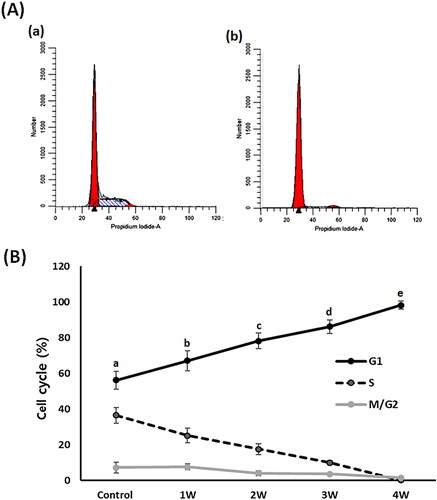
Figure 6. Analysis of cell cycle phase in A549 cancer cells treated with 50 μM PGZ up to 4 weeks. A: representative example in untreated control (a) and 50 μM PGZ-treated (b) A549 cancer cells for 4 weeks. B: The ratio of G1, S and M/G2 phase of cell cycles among each treatment week. a, b, c, d and e indicate different groups which are significantly different each other (p < .05, one-way ANOVA).