Figures & data
Figure 1. Experimental scheme showing the 2,4-Dinitrochlorobenzene (DNCB)-induced atopic dermatitis (AD) model. On days 0, 4, and 7, mice were sensitized with 200 and 20 μL of 1% DNCB or vehicle at their shaved back and right ear, respectively. Three days after the first sensitization, 0.3% DNCB was applied to challenge the dorsal skin (200 μL) and the right ear (10 μL) for 4 days. From day 18 onwards, 0.3% of DNCB or vehicle was applied to challenge the dorsal skin and right ear every three days until the end of experiments. AD-induced mice were co-treated with either FB801 once daily or dexamethasone every three days from day 10 onwards until the end of experiments.
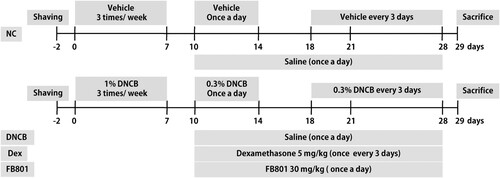
Figure 2. Effects of FB801 on atopic dermatitis (AD)-like clinical signs in 2,4-Dinitrochlorobenzene (DNCB)-treated mice. (A) To examine the severity of AD-like lesions, photographs of mouse dorsal skin were taken before mice were sacrificed on the 28th day of the experiment. (B) Skin severity scores of AD-like skin lesions in BALB/c mice. The total score is the sum of individual scores determined based on symptoms of erythema/hemorrhage, edema, scaling/dryness, and excoriation/erosion. (C) Scratching incidence and (D) Ear thickness were evaluated once a week. Data are expressed as mean ± SEM of five mice per group. ###P < 0.001 compared with the normal control (NC) group; ***P < 0.001 compared with DNCB-stimulated group.
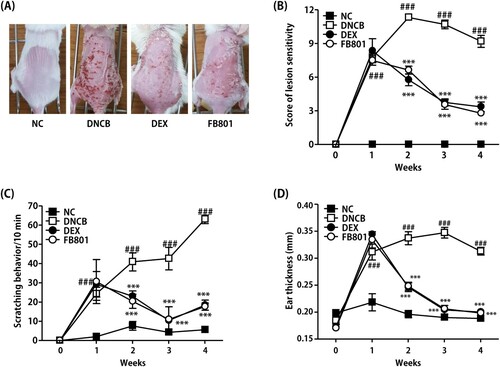
Figure 3. FB801 reduces dermal infiltration of inflammatory cells and mast cells in 2,4-Dinitrochlorobenzene (DNCB)-treated BALB/c mice. Cut dorsal skin was fixed with 10% buffered formalin, cut into 6-μm sections, and stained with hematoxylin and eosin (H&E, upper panel, bar: 100 µm) or toluidine blue (lower panel, bar: 100 µm). Photographs of each group represent images of all mice (n = 5). Images were taken at 200× magnification. (B) Epidermal thickness was analyzed for H&E stained sections. (C) The number of infiltrated mast cells in the dermis was examined after toluidine blue staining of skin sections. It was counted in five fields per mice. Data are expressed as mean ± SEM of five mice per group. ###P < 0.001 compared with the normal control (NC) group; ***P < 0.001 compared with DNCB-stimulated group.
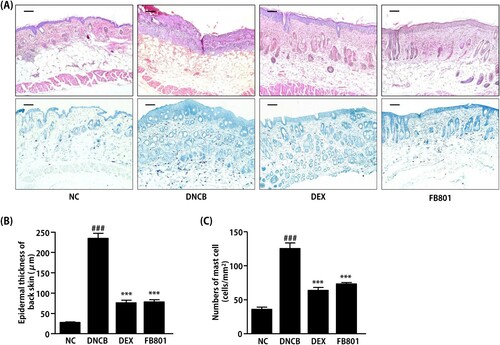
Figure 4. FB801 decreases serum levels of immunoglobulin E (IgE) and proinflammatory cytokines. Blood samples were collected from each mouse. Serum levels of (A) IgE, (B) interleukin (IL)-4, (C) interferon-γ, and (D) IL-10 were quantified by ELISA. Data are expressed as mean ± SEM of five mice per group. #P < 0.05 and ###P < 0.001 compared to the normal control (NC) group. *P < 0.05 and **P < 0.01 compared to DNCB-stimulated group.
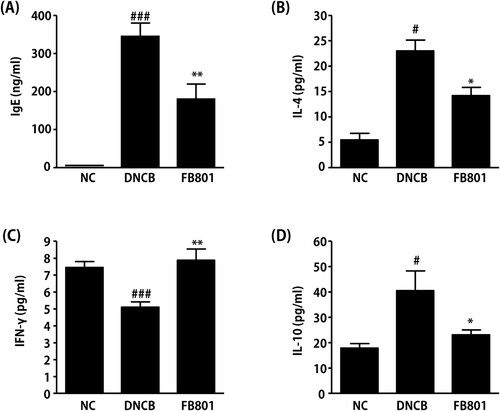
Figure 5. FB801 inhibits the inflammatory responses in tumor necrosis factor (TNF)-α-treated keratinocytes. (A) HaCaT cells were incubated with indicated concentrations of FB801 for 24 h, and cell viability was determined by Cell Counting Kit-8. HaCaT cells were pretreated with indicated concentrations of FB801 for 4 h and stimulated with TNF-α (10 ng/mL) for another 24 h. TNF-α (B) and interleukin-6 (C) levels were measured using culture supernatants by enzyme-linked immunosorbent assay. The values shown represent the mean ± SEM. *P < 0.05, ***P < 0.001, versus TNF-α-treated cells; ###P < 0.001 versus non-treated control cells.
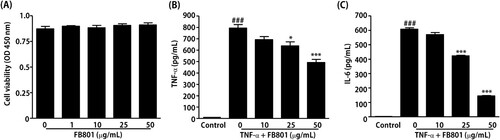
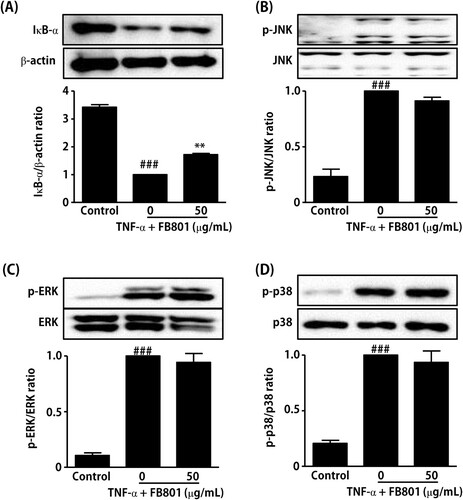
Figure 6. Effect of FB801 treatment on tumor necrosis factor (TNF)-α-induced nuclear factor-κB (NF-κB) and mitogen-activated protein kinase (MAPK) activation in HaCaT cells. HaCaT cells were treated with 50 μg/mL of FB801 for 4 h and stimulated with TNF-α (10 ng/mL) for another 15 min. (A) IκB-α protein levels were analyzed in whole cell lysates using Western blots, β-actin expression was used as an internal control. Phosphorylation and total protein expression of JNK (B), ERK 1/2 (C) and p38 (D) signaling proteins were analyzed in whole cell lysates using Western blot analysis. The values shown represent the mean ± SEM. **P < 0.001, versus TNF-α-treated cells; ###P < 0.001 versus non-treated control cells.