Figures & data
Figure 1. Tissue harvesting, cell culture, and morphological characterization. (A) The site of tissue harvesting for ankylosed callus or cancellous bone of the condyle. (B) FA-MSCs, BA-MSCs, and BM-MSCs showing similar morphologies on days 2 and 9. Scale bar, 200 μm. FA, fibrous ankylosis; BA, bony ankylosis; BM, bone marrow; MSCs, mesenchymal stromal cells.
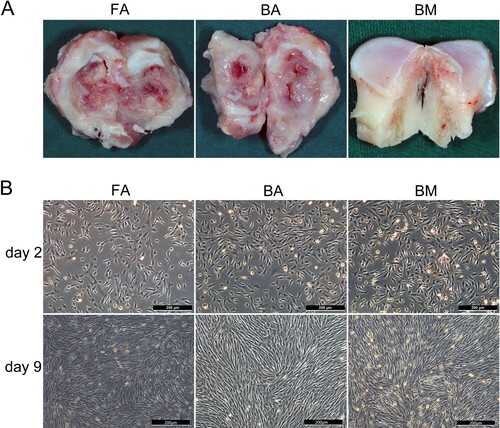
Figure 2. Phenotypic characterization of FA-MSCs, BA-MSCs, and BM-MSCs by flow cytometry. The green curve signifies the specific antibody, while the orange curve represents the isotype control. (A) Several commercial monoclonal antibodies that react with human or mouse MSCs but show no reactivity to ovine MSCs. (B) Markers characteristic of MSCs and hematopoietic cells that react with sheep. (C) and (D) Bar graph representing the percentage mean values (mean ± standard deviation) of the positivity of the following markers analyzed from three samples: characteristic markers of MSCs (CD29, CD44, and CD166) and hematopoietic cells (CD31 and CD45). FA, fibrous ankylosis; BA, bony ankylosis; BM, bone marrow; MSCs, mesenchymal stromal cells.
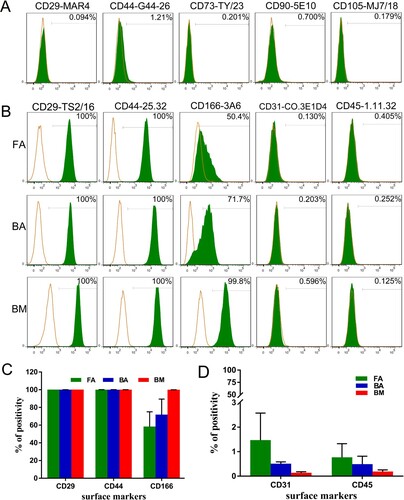
Figure 3. Immunofluorescence staining of FA-MSCs, BA-MSCs, and BM-MSCs. All nuclei are stained with DAPI (blue). Co-expressions of CD29 (clone TS2/16) and CD44 (clone 25.32) by different groups of MSCs are confirmed. Scale bar: 100 μm. FA, fibrous ankylosis; BA, bony ankylosis; BM, bone marrow; MSCs, mesenchymal stromal cells.
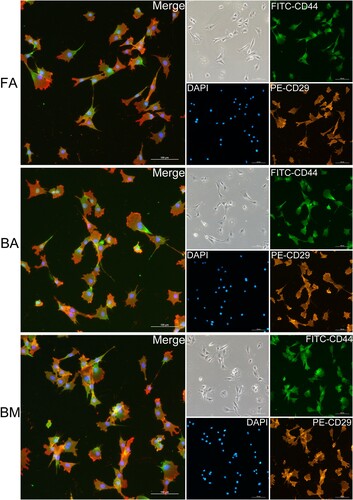
Figure 4. Clonogenic abilities and cell proliferation analysis. (A) and (B) The colony-forming unit assay showing different clonogenic potentials in the nine groups of MSCs stained with violet crystal. (C) Bar graph representing the mean colony-forming efficiency (mean ± standard deviation) analyzed from three samples. *P < .05. (D) Cell proliferation analysis using the CCK-8 assay. Data are displayed as mean ± standard deviation analyzed from the three samples. *P < .05 (FA-MSCs vs. BM-MSCs), #P < .05 (BA-MSCs vs. BM-MSCs), and $P < .05 (BA-MSCs vs. FA-MSCs). FA, fibrous ankylosis; BA, bony ankylosis; BM, bone marrow; MSCs, mesenchymal stromal cells.
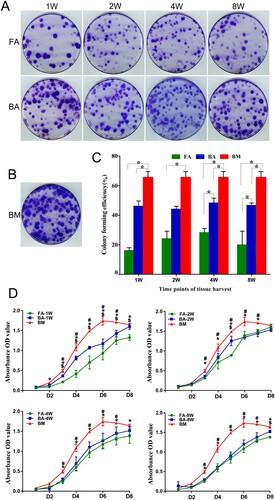
Figure 5. Osteogenic differentiation assay for the detection of calcium deposits using alizarin red (AR) stain. (A) and (B) Mineralized calcium nodules in an osteogenic differentiation medium (+) after culture for 14 days compared with the negative AR staining in the control medium (−) for each group of MSCs. Scale bar: 100 μm. (C) Bar graph representing the percentage of area with positive staining for AR, expressed as mean ± standard deviation. Calcium deposits were measured in three independent samples for each group (n = 3). *P < .05. FA, fibrous ankylosis; BA, bony ankylosis; BM, bone marrow; MSCs, mesenchymal stromal cells.
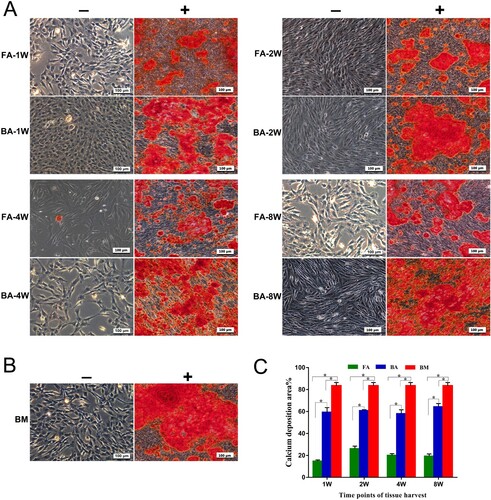
Figure 6. Osteogenic differentiation potential confirmed by the detection of the expressions of the osteoblast marker genes by using quantitative real-time polymerase chain reaction. (A) Analysis of the expressions of the osteogenic-specific genes for the 7-day stimulated MSC populations. (B) Analysis of the expressions of the osteogenic-specific genes for the 14-day stimulated MSCs populations. mRNA levels were measured in three independent samples (n = 3). Data are expressed as mean ± standard deviation. *P < .05. FA, fibrous ankylosis; BA, bony ankylosis; BM, bone marrow; MSCs, mesenchymal stromal cells.
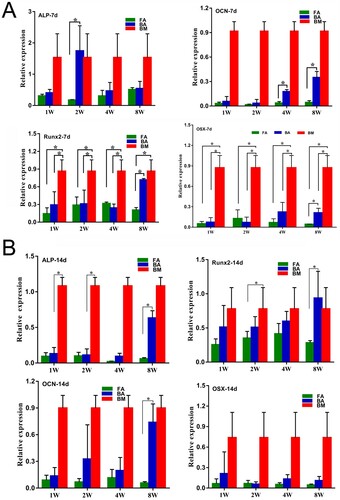
Figure 7. Chondrogenic differentiation capabilities of the nine groups of MSCs. (A)–(D) MSCs in a 21-day micromass culture with non-differentiation control (−) and chondrogenic differentiation media (+). (A) and (C) Micromasses stained with Alcian blue. (B) and (D) Immunodetection of type II collagen assessed in micromasses. Scale bar: 100 μm. (E) Quantitative real-time polymerase chain reaction measurements of the expression levels of the chondrogenic markers Sox9 and Col2a1. mRNA levels were measured in three independent samples (n = 3). Data are expressed as mean ± standard deviation. *P < .05. FA, fibrous ankylosis; BA, bony ankylosis; BM, bone marrow; MSCs, mesenchymal stromal cells.
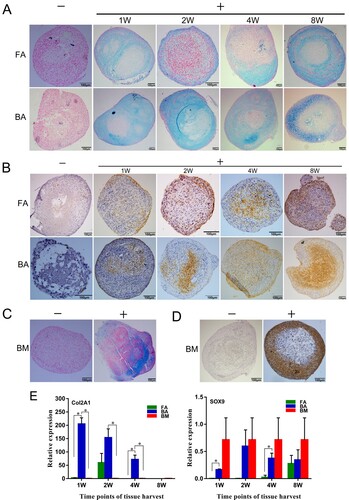
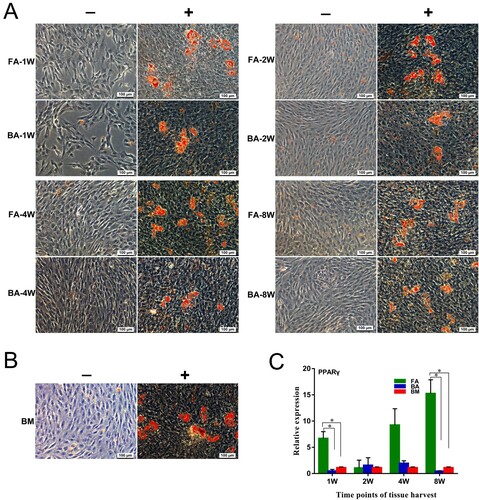
Figure 8. Adipogenic differentiation capabilities of the nine groups of MSCs. (A) and (B) MSCs are cultured for 21 days in non-differentiation control (−) and adipogenic differentiation media (+). The presence of adipocytes was assessed by detection of lipid drops using Oil Red O stain. Scale bar: 100 μm. (C) Quantitative real-time polymerase chain reaction measurements of the expression levels of the adipogenic marker PPARγ. mRNA levels were measured in three independent samples (n = 3). Data are expressed as mean ± standard deviation. *P < .05. FA, fibrous ankylosis; BA, bony ankylosis; BM, bone marrow; MSCs, mesenchymal stromal cells.