Figures & data
Figure 1. The amino acid sequence and a diagram of rpS3. (A) Amino acid sequence of human 40S ribosomal protein S3 (upper panel). Schematic representation of human rpS3. The gray area represents the N-terminal apoptotic domain. The black box indicates the C-terminal amino acids, which are sufficient for the repair endonuclease activity of rpS3. There are domains, represented by blank boxes, in both termini that appear to regulate apoptotic activities in a negative manner. KH domain is a highly conserved motif found in RNA binding proteins (down panel). (B) Ribosomal protein S3 protein sequence alignment of Homo sapiens (NP_001243731.1) and Mus musculus (NP_036182.1).
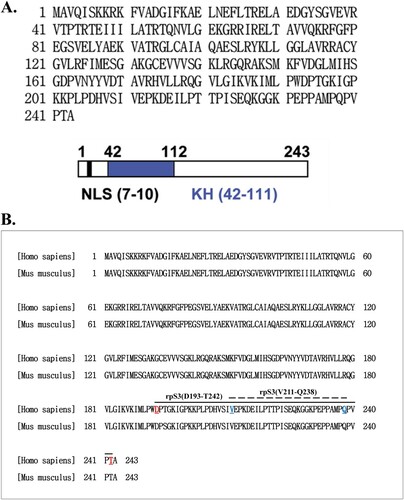
Figure 2. Identification of epitope binding region using monoclonal antibodies against rpS3. (A and B) Western blotting was performed using hybridoma clone supernatant M8 and specific mAb M7, pAb R2 against rpS3 using the GST-rpS3 recombinant protein purified in the previous experiment as an antigen (Table S1). After incubated with anti-M7 (1:500) at 4°C for overnight, anti-R2 (1:2000), and anti-M8 (hybridoma clone supernatant) as the first antibody, the second antibody is anti-Mouse (M7, M8; 1:2000) and anti-rabbit (R2; 1:2000) were used. Recombinant protein GST was used as a negative control. Recombinant protein GST-S3-P(C-terminal region) was used as a positive control. (C and E) Specific antigens were detected in the sample using direct ELISA assay, and the specificity of each antibody was confirmed. Twelve GST tagged overlapping recombinant proteins of rpS3 were coated onto a plate, and 100 μL of mouse monoclonal clone was added at each well. The wells were probed with horseradish peroxidase (HRP) conjugated goat anti-mouse antibody mIgG (1:2000) and subsequently developed by adding 100 μL of chromogenic substrate. The optical density was measured at 450 nm. It was confirmed that the mouse monoclonal clone targets the epitope binding site of rpS3 and is therefore specific for rpS3 as described in the Supplementary experimental (Figure S2) procedure and GST-S3-P was used as a positive control. GST (empty vector) was a negative control.
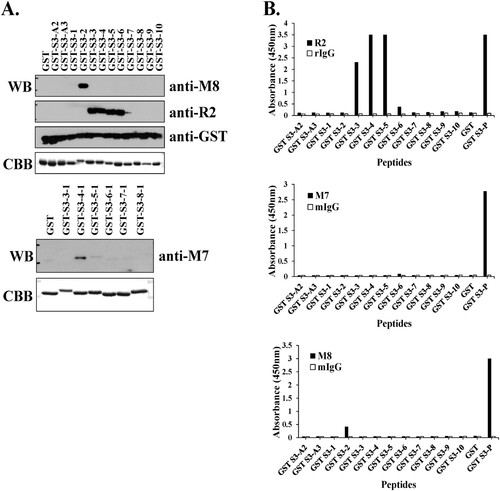
Figure 3. The conformational epitope of pAb R2 was identified using competitive ELISA. (A) Competitive ELISA assay was performed using 12 GST tagged overlapping recombinant protein fragments of rpS3(193-242 aa). (B) Competitive ELISA assay was performed using six GST tagged overlapping recombinant protein fragments of rpS3(211-238 aa). GST-S3-P was used as a positive control. GST (empty vector) was a negative control.
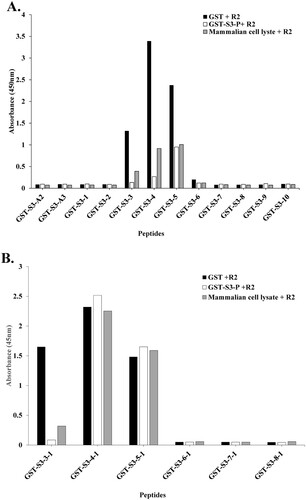
Figure 4. Epitope mapping of mAb M7 and pAb R2 in synthesized peptides. (A) and (B) To perform peptide scanning, 52 peptides designed with rpS3 (185-243) were synthesized with overlapping 15mer-long peptides and 14mer amino acids. Epitope mapping of (A) mAb M7 and (B) pAb R2 in the synthesized peptides was performed using direct ELISA. Synthesized peptides were coated on a 96-well plate at a concentration of 10 μg/mL and incubated at 4°C for overnight. This was blocked with 4% BSA in 0.1% PBST (400 μL/well) the next day at 37°C for 1 h. After washing four times with 0.1% PBST (400 μL/well), 4% BSA in PBST (400 μL/well) was blocked at 37°C for 1 h. In addition, washed with 0.1% PBST (400 μL/well) for four times. And pAb R2 (2 μg/mL, 100 μL/well) and mAb M7 (16 μg/mL, 100 μL/well) were used as primary antibodies and incubated at 37°C for 1 h 30 min. Thereafter, 0.1% PBST (400 μL/well) was washed four times, and the secondary antibodies rIgG-HRP (pAb R2; 100 μL/well) and mIgG-HRP (mAb M7; 100 μL/well) was diluted 1:5000 in 0.1% PBST and incubated at 37°C for 1 h. After washing four times with 0.1% PBST (400 μL/well), reacting TMB substrate (100 μL/well) at 37°C for 5 min, treatment with STOP solution (100 μL/well) and it was measured in the ELISA reader of 450 nm. GST was used as a negative control, and GST-S3-P was used as a positive control.
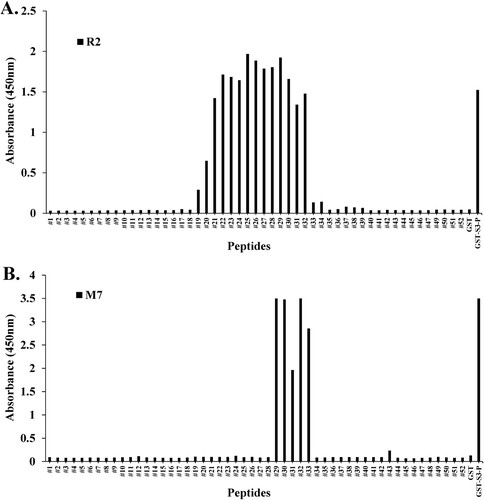
Figure 5. Hybridoma clones for monoclonal antibody production were identified using Western blotting and direct ELISA. (A) For clonal testing of six hybridoma clones, siRNA was transfected into HT1080 cells, and the knockdown of rpS3 was compared with a commercial anti-rpS3 antibody (RPS3) through Western blotting using the hybridoma clone as a primary antibody. mAb M7 was used as a positive control. SC; scramble, control. (B) Epitope identification of hybridoma clones by direct ELISA. (C) Direct ELISA for stable and homogeneous clone selection. GST-S3-P (C-terminal region) was used as a positive control. GST (empty vector) was a negative control. (D) Coomassie blue staining SDS-PAGE analysis for purification of monoclonal antibody M8 against rpS3 after affinity chromatography on Protein A/G Plus column. After purification of mAb M8, samples were analyzed on 12% SDS-PAGE, followed by Coomassie blue staining. Heavy and light chains are indicated by arrows. The positive control was normal IgG.
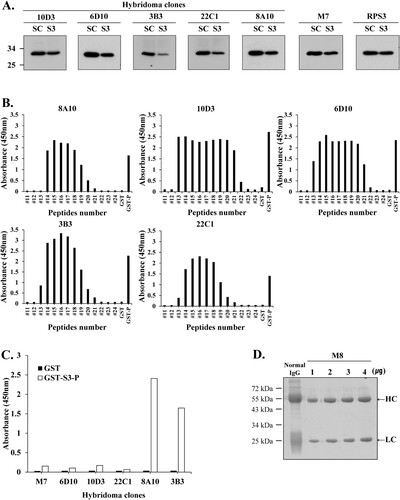
Figure 6. Epitope mapping of mAb M7 and pAb R2 in the recombinant proteins His-S3 (FL) and GST-S3-P (C-terminal region) was performed using direct ELISA and sandwich ELISA. (A) To perform direct ELISA assay, the recombinant protein was coated on a 96-well plate at a concentration of 10 μg/mL (100 μL/well) and incubated at 4°C for overnight. This was blocked with 4% BSA in 0.1% PBST (400 μL/well) at 37°C for 1 h. After washing four times with 0.1% PBST (400 μL/well), 4% BSA in PBST (400 μL/well) was blocked at 37°C for 1 h 30 min. In addition, 0.1% PBST (0.1% Tween 20 in PBS) (400 μL/well) was washed four times and pAbs R2 (2 μg/mL, 100 μL/well), M7, M8, mIgG2b, rIgG (16 μg/mL) as a primary antibody, 100 μL/well) was incubated at 37°C for 1 h 30 min. Thereafter, 0.1% PBST (400 μL/well) was washed four times, and the secondary antibodies rIgG-HRP (pAb R2, rIgG; 100 μL/well) and mIgG-HRP (mAb M7, M8, mIgG2b; 100 μL/well) was diluted 1:5000 in 0.1% PBST and incubated at 37°C for 1 h. After, it was washed three times with PBST. 100 μL/well of TMB substrate was added for color development. Plates were measured at 450 nm by an ELISA plate reader. GST-S3-P was used as a positive control. (B) To perform sandwich ELISA, pAb R2 and rIgG, as capture Abs were diluted to 2 μg/mL in PBS/0.1% Tween 20 (PBST). Then, 100 μL of the solution was coated on the wells of the ELISA plate at 4°C for overnight. Wells were washed four times with 0.1% PBST. 0.1% PBST containing 4% BSA was added at 400 μL/well and incubated at 37°C for 1 h 30 min. Wells were washed four times with PBST. 100 μL of the peptide or recombinant protein diluted at a concentration of 100 ng/mL was added to each well of the plate, and the plate was maintained at 37°C for 1 h. At the end of this period, the plates were washed four times with PBST. The primary antibody, as M7, M8, mIgG (16 μg/mL) was diluted in PBST containing 1% BSA, and 100 μL/well was added. The plate was left at 37°C for 2 h. At the end, the plate was washed three times with PBST. HRP-conjugated rIgG or mIgG was diluted 1:2000 in PBST containing 1% BSA, and 100 μL was added to each well and stored at 37°C for 1 h. After, it was washed three times with PBST. 100 μL/well of TMB substrate was added for color development. Plates were measured at 450 nm by an ELISA plate reader.
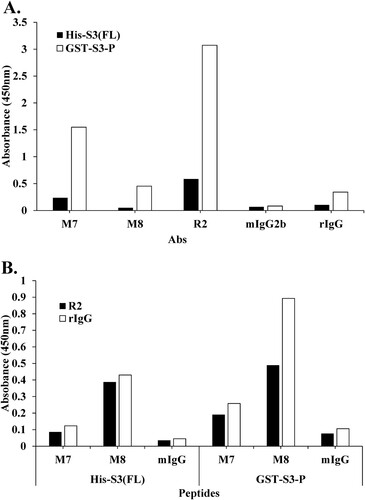
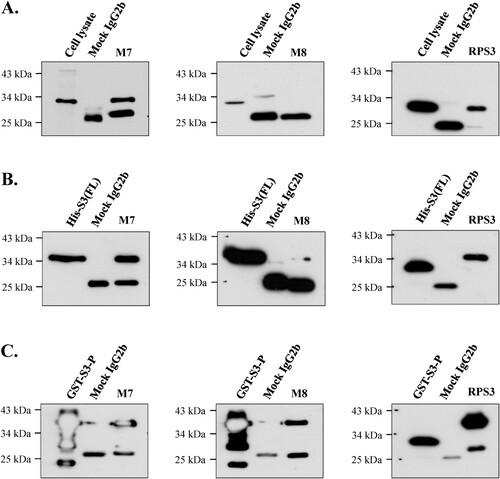
Figure 7. Identification of immunoprecipitation of mAbs in various proteins. The possibility of immunoprecipitation of mAbs M7 and M8 was confirmed through immunoprecipitation assay. (A) To confirm immunoprecipitation, HT1080 cell lysate, (B) and (C) were bacterial cells recombinant protein (His-S3 (FL), GST-S3-P) was performed. The mAbs M7, M8, and mock IgG2b were cross-linked to protein A-Sepharose beads (GE Healthcare) with cell lysis buffer (50 mM Tris-HCl, pH 7.4, 150 mM NaCl, 1% Triton X-100, 0.5% Sodium deoxycholate, 0.1% SDS, 2 mM EDTA). Immunoprecipitated proteins were analyzed by SDS-PAGE and western blotting. Commercial anti-rpS3 monoclonal antibody (RPS3) was used as a positive control.