Figures & data
Figure 1 . UCH-L1 and UCH-L3 regulate the pluripotency markers in RWPE1 cells. (A) The expression of pluripotency markers, including Oct4, Nanog, Bmi1, Klf4, and Sox2, were examined by immunoblotting in RWPE1 stable cell lines as indicated. β-actin was used as the loading control. (B) Real-time quantitative RT-PCR analysis of Oct4, Nanog, Bmi1, Klf4, and Sox2 in RWPE1 stable cell lines. The values shown are the mean ± SD of three independent experiments, and the p-value was obtained from a Student’s t-test. *p < 0.05, **p < 0.01, ***p < 0.001.
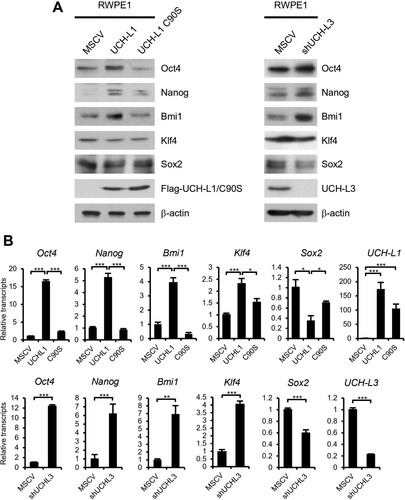
Figure 2. UCH-L1 and UCH-L3 regulate the CSC-like behaviors in RWPE1 cells. (A) The self-renewal capacity of each cell was evaluated using a sphere forming assay. An equal number of each stable cell was cultured in 96-well ultra-low attachment dishes for 14 days. The figure shows a representative image from each cell, and the scale bar corresponds to 200 μm was adjusted to all images. (B) The number of spheres with a diameter greater than 100 μm per field was counted. (C) The cell viability of each stable cell was monitored in a time-dependent manner after treating 0.5 μg/mL doxorubicin and 50 μM etoposide or in a dose-dependent manner after treating MTX for 48 h. (D) Real-time quantitative RT-PCR analysis of CD44, CD133, and ABCG2 in RWPE1 stable cells. The values shown are the mean ± SD of three independent experiments. The p-value was obtained using a Student’s t-test. *p < 0.05, **p < 0.01, ***p < 0.001.
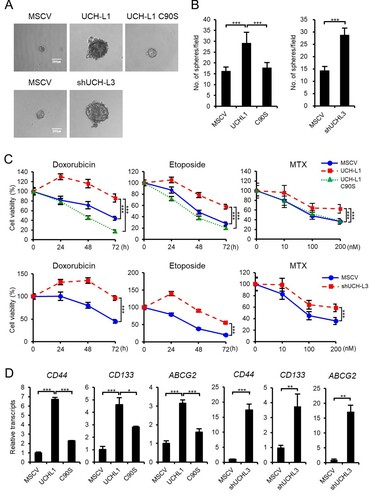
Figure 3. UCH-L1 and UCH-L3 regulate the PI3 K/Akt signaling pathway in RWPE1 cells. (A) The protein levels of several PI3 K/Akt signaling molecules, as indicated in each stable cell, were examined by western blotting. (B) After incubation with DMSO or 200 nM BEZ235 for 48 h, the protein level of several PI3 K/Akt signaling molecules indicated in each stable cell was examined by western blotting.
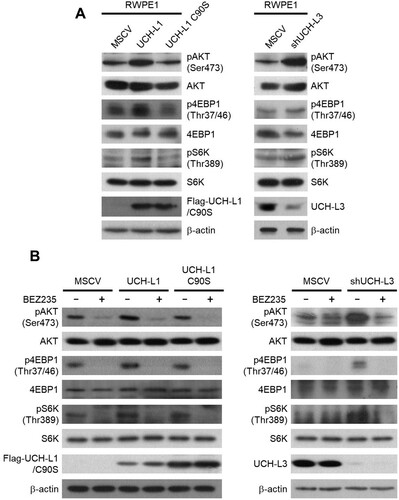
Figure 4. UCH-L1 and UCH-L3 regulate the CSC-like properties through the PI3 K/Akt pathway in RWPE1 cells. (A) Real-time quantitative RT-PCR analysis of Oct4, Nanog, and Bmi1 in DMSO or 200 nM BEZ235 treated RWPE1 stable cell. (B) Sphere forming capacities of each RWPE1 stable cell was measured in 96-well ultra-low attachment dishes after DMSO or 200 nM BEZ235 treatment for 14 days. The figure shows a representative image from each cell, and the scale bar corresponding to 200 μm was adjusted to all images. The number of spheres with a diameter greater than 100 μm per field was counted. (C) The cell viability of each stable cell was measured in a time-dependent manner after treatment with 0.5 μg/mL doxorubicin and 50 μM etoposide or in a dose-dependent manner after treatment with MTX for 48 h in the presence or absence of 200 nM BEZ235. The values shown are the mean ± SD of three independent experiments, and the p-value was obtained from a Student’s t-test. *p < 0.05, **p < 0.01, ***p < 0.001.
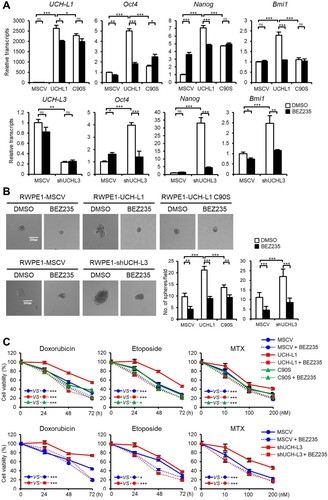
Figure 5. LY294002 inhibits sphere formation in RWPE1 stable cells. (A) Sphere forming capacities of each RWPE1 stable cell was measured in 96-well ultra-low attachment dishes after 50 μg/mL LY294002 treatment for 14 days. The figures show representative images from each cell, and the scale bar corresponding to 200 μm was adjusted to all images. (B) The number of spheres with a diameter greater than 100 μm per field was counted. The values shown are the mean ± SD of three independent experiments, and the p-value was obtained using a Student’s t-test. *p < 0.05, **p < 0.01, ***p < 0.001.
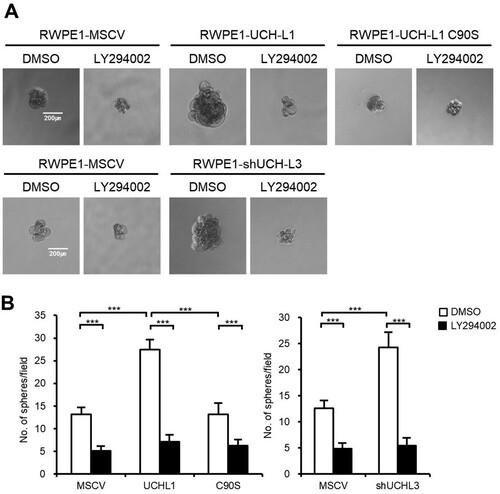
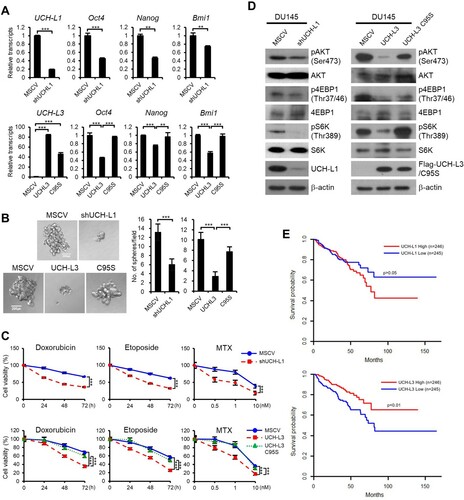
Figure 6. UCH-L1 and UCH-L3 regulate the CSC-like properties through the PI3K/Akt signaling pathway in DU145 cells. (A) Real-time quantitative RT-PCR analysis of Oct4, Nanog, and Bmi1 in each DU145 stable cell. (B) Each DU145 stable cell was cultured in 96-well ultra-low attachment dishes, and the spheres formed after seven days were observed. The figure shows a representative image from each cell, and the scale bar corresponding to 200 μm was adjusted to all images. The number of spheres larger than 100 μm in diameter per field was counted. (C) The cell viability of each DU145 stable cell was monitored in a time-dependent manner after treating the cells with 0.5 μg/mL doxorubicin or 50 μM etoposide and in a dose-dependent manner after treating the cells with MTX for 48 h. (D) Western blotting analysis of several PI3 K/Akt signaling molecules, as indicated in each DU145 stable cell. (E) Kaplan-Meier disease-free survival curves for the high (n = 246) and low (n = 245) UCH-L1 or UCH-L3 expression groups. Each group was stratified by the median expression of UCH-L1 and UCH-L3. The values shown are the mean ± SD of three independent experiments, and the p-value was obtained from a Student’s t-test. *p < 0.05, **p < 0.01, ***p < 0.001.