Figures & data
Figure 1. Type of intestinal transit zone. To analyze intestinal transit in zebrafish populations, individual larvae were classified into four zones according to the location of the fluorescent tracer in the intestinal tract. Zone 1 was the region of the intestinal bulb rostral to the swim bladder. Zone 2 was the region of the intestinal bulb ventral to the swim bladder. Zone 3 was the region of the junction between the swim bladder and the mid-intestine. Zone 4 was the region between the mid-intestine and posterior intestine. DIC, differential interference contrast microscopy; FITC, FITC fluorescence microscopy; DIC + FITC, merged DIC and FITC images.
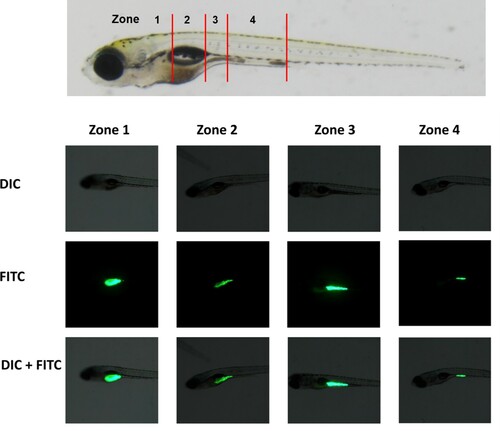
Figure 2. Delayed intestinal transit with loperamide treatment. Eight dpf zebrafish larvae were fed with a fluorescent tracer then treated with loperamide (1, 5 mg/L) for two hours. The intestinal transit zones of zebrafish larvae were analyzed two hours after loperamide exposure. The data represent population percentages. **P < 0.01 and ***P < 0.001 compared to the control.
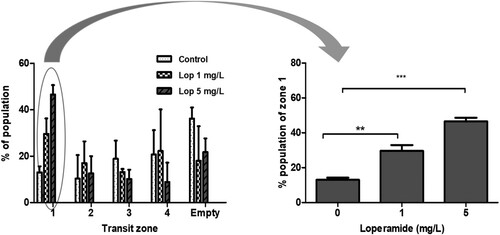
Figure 3. Change in intestinal motility after gastrografin treatment in the loperamide-induced constipation model. (A) 8 dpf zebrafish larvae with loperamide (5 mg/L)-induced constipation were treated with 4 µl/ml gastrografin. Afterward, we analyzed the intestinal transit zones of these larvae. (B) Intestinal contraction in zebrafish larvae with loperamide-induced constipation was compared via real-time video analysis. The data represent population percentages (**P < 0.01, ***P < 0.001)
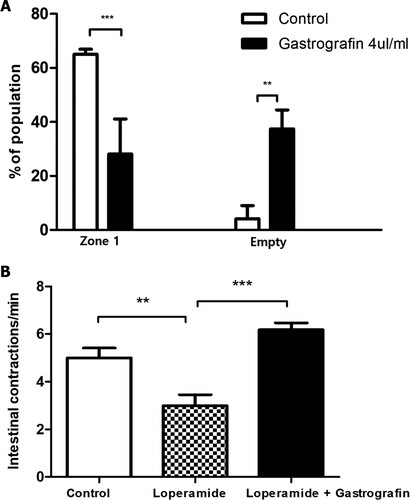
Figure 4. Effect of gastrografin on (A) the mRNA expression of kit genes and (B) C-kit protein expression in zebrafish larvae with loperamide-induced constipation. Lop, loperamide; la, ligand a; lb, ligand b (***P < 0.001).
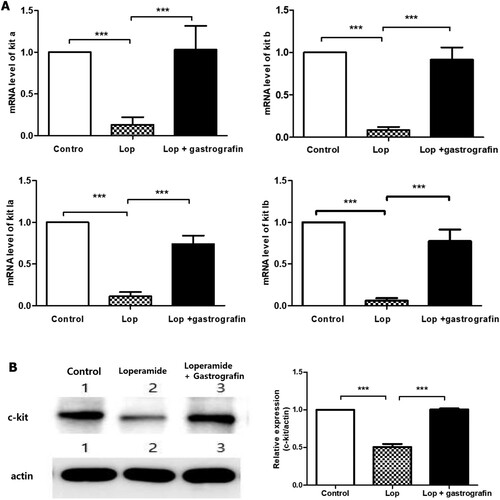
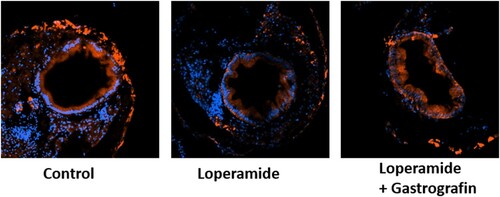
Figure 5. Transverse section views (×20) of 8 dpf larva subjected to immunohistochemical staining with anti-c-kit antibody (red) and DAPI (blue).