Figures & data
Figure 1. Lithium has synapto-protective effect against HIV-1 Tat-mediated synapse loss. A, Analyzed confocal images for synaptic puncta of hippocampal neurons expressing PSD95 and MAP2 after 24 h treatment under control (Control), 50 ng/ml HIV-1 Tat (Tat) and 5 mM Lithium-treated conditions in the presence of 50 ng/ml HIV-1 Tat (Tat + 5mM Li+). Analysis of PSD puncta using the algorithm of image process display lithium increased PSD puncta against HIV-1 Tat-induced synapse loss. Processed confocal images expressing PSD95 and MAP2, analyzed using Image J program. Scale bar, 100 µm. B, Bar graph shows significant change in the PSD puncta following treatment with 5 mM lithium in the absence (untreated) or the presence of 50 ng/ml HIV-1 Tat as indicated. Data are expressed as mean ± SEM; **p < 0.01 relative to untreated control; ###p < 0.001 relative to HIV-1 Tat alone (ANOVA with Bonferroni post test). C, Bar graph shows significant change in the intensity of PSDs following treatment with 5 mM lithium and 1 mM valproic acid in the absence (untreated) or the presence of 50 ng/ml HIV-1 Tat as indicated. Processing of PSD95 images identified PSDs as mean intensity after subtraction of background intensity (threshold: 3000). Data are expressed as mean ± SEM; ***p < 0.001 relative to untreated control; #p < 0.05 and ####p < 0.0001 relative to HIV-1 Tat alone (ANOVA with Bonferroni post test). D, Bar graph shows cell survival changes after 48 h for untreated cells (Control) and cells treated with 5 mM lithium or 100 µM L-NAME in the absence and the presence of 50 ng/ml HIV-1 Tat (HI-Tat; heat-inactivated Tat). Data are expressed as mean ± SEM; ****p < 0.0001 relative to control; ###p < 0.001 and ####p < 0.0001 relative to 48 h HIV-1 Tat alone (ANOVA with Bonferroni post test).
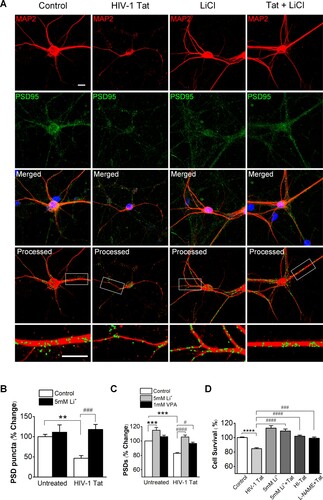
Figure 2. Lithium potentiates synapto-protective effect mediated by activation of NMDA receptors. A, Bar graph summarizes the effects of inhibitors on changes in PSD95 intensity (PSDs) 24 h after treatment under control, HIV-1 Tat-treated (HIV-1 Tat) or HIV-1 Tat and Lithium-treated conditions (HIV-1 Tat + Li+). Cultures were treated with 1 µM Nutlin-3 or 100 µM L-NAME for 30 min following addition of HIV-1 Tat. Data are expressed as mean ± SEM; ****p < 0.0001 relative to untreated control; #p < 0.05 and ####p < 0.0001 relative to HIV-1 Tat alone (Untreated); +p < 0.05 and ++p < 0.01 relative to HIV-1 Tat + inhibitors (ANOVA with Bonferroni post test). B, Bar graph summarizes the effects of inhibitors associated with activation of NMDA receptor on changes in PSD95 intensity (PSDs) 24 hr after treatment under control, HIV-1 Tat-treated (HIV-1 Tat) or HIV-1 Tat and Lithium-treated conditions (HIV-1 Tat + Li+). Cultures were treated with 20 µM AP5 for 15 min, 10 µM PP2 and 10 µM PP3 for 1 h following addition of HIV-1 Tat. Data are expressed as mean ± SEM; ****p < 0.0001 relative to untreated control; #p < 0.05, ###p < 0.001 and ####p < 0.0001 relative to HIV-1 Tat alone (Untreated); +p < 0.05 and +++p < 0.001 relative to HIV-1 Tat + inhibitors (ANOVA with Bonferroni post test).
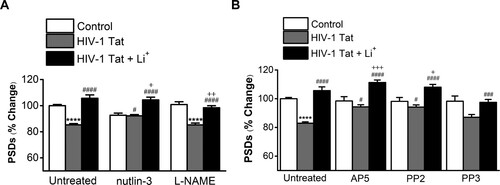
Figure 3. GSK-3β inhibitor and inositol depletion increases the intensity of PSDs against HIV-1 Tat-induced synapse loss. Bar graph summarizes the effects of GSK-3β inhibitor SB216763 and inositol depletion on changes in the intensity of PSD95. Data are expressed as mean ± SEM; *p < 0.05, ***p < 0.001 and ****p < 0.0001 relative to control; ##p < 0.05 and ####p < 0.0001 relative to HIV-1 Tat alone; ++++p < 0.0001 relative to HIV-1 Tat + Li+ (ANOVA with Bonferroni post test).
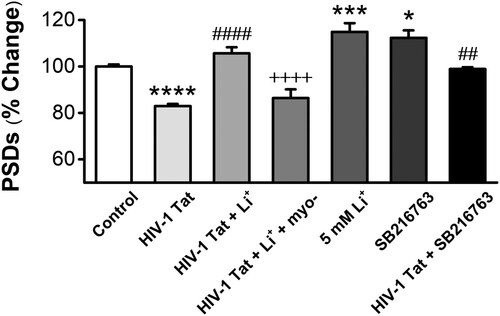
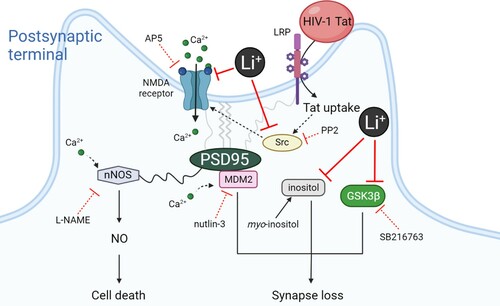
Figure 4. Schematic diagram illustrating the proposed mechanism of synapto-protective effects induced by lithium.