
Figures & data
Figure 1. Schematic representation of the experimental design adopted in this study.
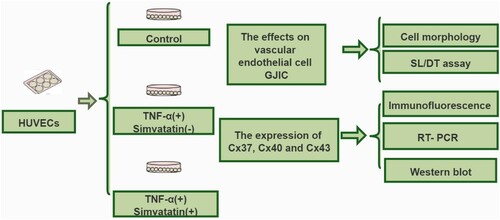
Table 1. List of oligonucleotide primers used for real-time PCR analysis.
Figure 2. Profiles of cell morphology (200× magnification). Pseudopod increased in the TNF-α treatment, relative to the control group, while pseudo foots were significantly lower in the TNF-α combined with simvastatin relative to the TNF-α alone group (red arrows). Contrast phase microscope 100×. B: Analysis of the number of pseudo foot in each group. Error bars represent SD, n = 6, ###P < 0.001 versus the control group, ***P < 0.001 versus the TNF-α treatment group. Bar = 100 μm.
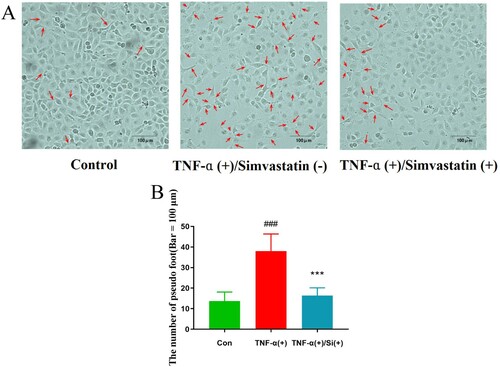
Figure 3. Simvastatin suppresses TNF-α-induced inhibition of GJIC activity in HUVECs, based on the Scrape loading assay. A: Fluorescence micrographs with Lucifer yellow (LY, MW: 457, 25 Da) and rhodamine-dextran (RD, MW: 10 kDa). (Original magnification ×10). B: The distance between the dye transfer front and the scrape line in each group. Error bars represent SD (n = 6), **P < 0.01 versus the TNF-α treatment group. Bar = 40 μm.
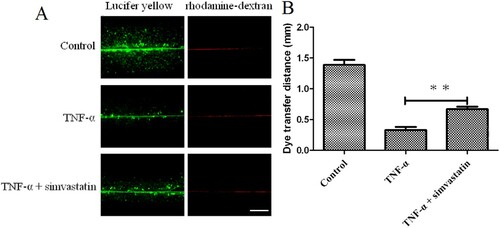
Figure 4. Immunofluorescence results showing effect of simvastatin on GJIC targeting Cx37, Cx40 and Cx43. Cx37 (A) and Cx40 (B) expression was downregulated in gap junctions of HUVECs treated with TNF-α relative to the control group. Treatment of HUVECs with simvastatin upregulated Cx37 and Cx40 expression. Similarly, HUVECs treated with TNF-α exhibited Cx43 up-regulation (C) although simvastatin reversed this phenomenon. D: Quantitative comparison of FITC staining intensity normalized to control. n = 6, *P < 0.05, **P < 0.01 vs. Control; #P < 0.05, ##P < 0.01 vs. TNF-α (+) Simvastain (−) group. Bar = 30 μm.
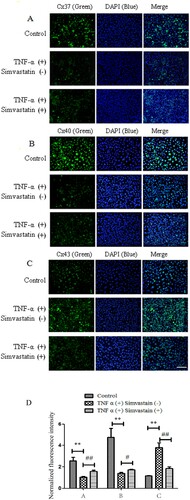
Figure 5. Differential expression of Cx37, Cx40 and Cx43 mRNAs in HUVECs across groups. Cx37 and Cx40 had a 2-fold downregulation, whereas Cx43 was upregulated relative to the control group. Cx37 and Cx40 were significantly upregulated in HUVECs treated with TNF-α in combination with simvastatin relative to those treated with TNF-α alone. Cx43 was significantly downregulated. Data presented are means ± SEM, n = 6, **P < 0.01 versus only TNF-α treatment group.
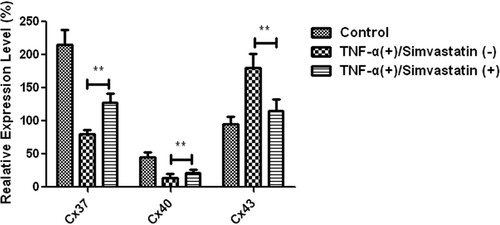
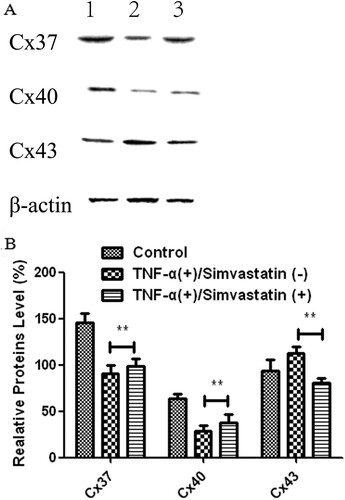
Figure 6. Cx37, Cx40 and Cx43 proteins were differentially expressed in HUVECs in different treatment groups. A: Western blots. 1: Control, 2: TNF-α (+)/Simvastatin (−), 3: TNF-α (+)/Simvastatin (+). B: qRT-PCR results showing relative transcript levels. Data presented are means ± SEM, n = 6, **P < 0.01 versus only TNF-α treatment group.
Data availability statement
Raw data supporting the conclusions of this article will be made available by the authors, without undue reservation, to any qualified researcher.