Figures & data
Figure 1. Effects of bisphenol A (BPA) on spermatogonial stem cells (SSCs) in vitro. (A) Effects of BPA on SSCs after culture for one week. BF, Bright field; GFP, green fluorescent protein. Scale bars = 200 μm. (B) The y-axis represents the proliferation rate and viability of BPA-treated murine SSCs. Cells were cultured with BPA for one week. Cell enrichment and survivability were calculated using a hemocytometer with the proper concentration of trypan blue dilution. Data were statistically analyzed by one-way analysis of variance (ANOVA). ns, no significant difference; ****P < 0.001 and **P < 0.01, respectively. Data are shown as mean ± standard error of the mean (SEM) (n = 3).
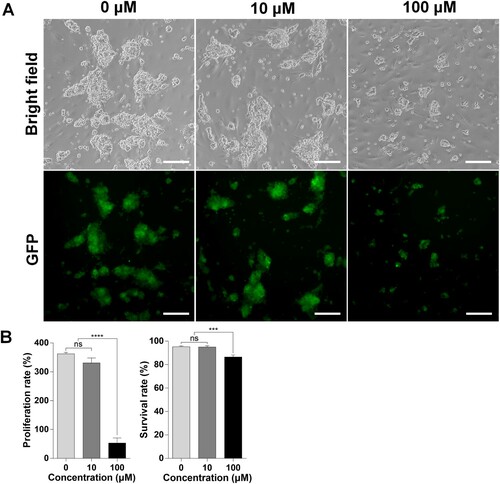
Figure 2. Differentially expressed genes (DEGs) in mouse germ cells, as assessed by RNA sequencing (RNA-Seq). (A) Multidimensional scaling (MDS) plot of the normalized trimmed mean of M-values (TMM) of RNA-Seq samples. MDS plot indicates cluster patterns of different samples. (B) Volcano plot indicates DEGs in spermatogonial stem cells (SSCs) at dosages of 10 and 100 μM bisphenol A (BPA). The color of each dot represents DEGs (navy and red) and nonsignificant DEGs (gray). (C) Box plot according to the direction of regulation of the expression of all DEGs.
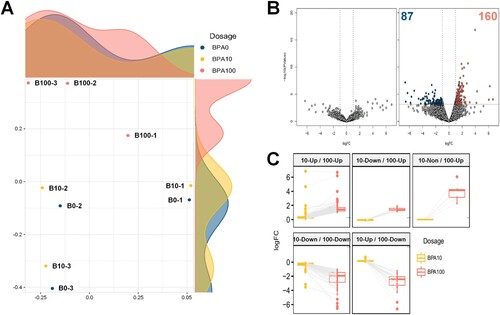
Figure 3. Enrichment analyses of biological significance for differentially expressed genes (DEGs) in spermatogonial stem cells (SSCs) exposed to 100 μM bisphenol A (BPA). (A) Tree maps for biological processes according to Gene Ontology (GO) analysis. Bold letters in the boxes represent DEGs enriched for representative terms. Larger boxes symbolize greater significance, and the box sizes are determined by the absolute value of the -log10 P-value. (B) Bar plot showing the fold enrichment and significance level for each Kyoto Encyclopedia of Genes and Genomes (KEGG) pathway term.
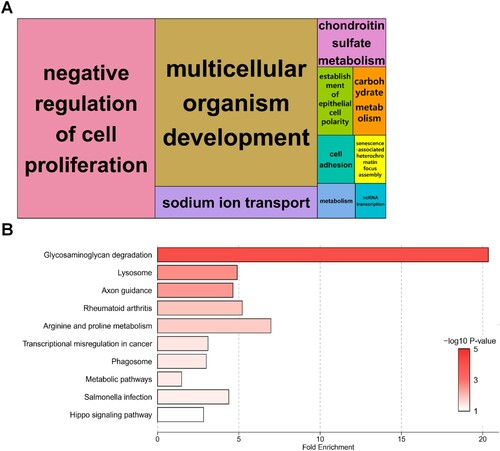
Figure 4. Gene set enrichment analysis (GSEA) based on the database of Kyoto Encyclopedia of Genes and Genomes (KEGG) pathways in spermatogonial stem cells (SCCs) treated with 100 μM bisphenol A (BPA). (A) Most significant functionally enriched KEGG pathway terms for SCCs treated with 100 μM BPA (q-value < 0.01). Dot size is proportional to the number of genes in the pathway. The color intensity of the dot (light to dark) indicates the level of significance. The x-axis indicates the normalized enrichment score (NES). (B) GSEA plot of the most significantly enriched pathways in SCCs treated with 100 μM BPA. (C) Subset of genes that have the most significant contributions to the lysosome gene sets. Bold and colored genes represent DEGs.
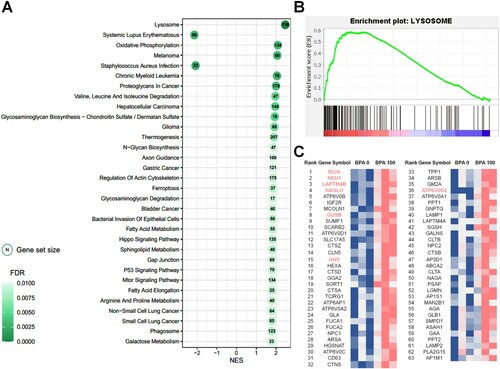
Figure 5. Gene expression profiling using quantitative real-time polymerase chain reaction (qRT-PCR). (A) Relative gene expression was measured using qRT-PCR. Samples were collected after culturing spermatogonial stem cells (SSCs) with bisphenol A (BPA) for one week. Differences in gene expression were normalized to the 0 μM-BPA treatment group as fold change. The x-axis shows the BPA concentration. Data were statistically analyzed by one-way analysis of variance (ANOVA). ns, no significant difference; *P < 0.05 and **P < 0.01. Data are shown as mean ± standard error of the mean (SEM) (n = 3).
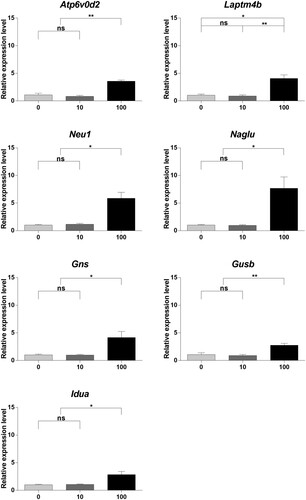
Figure 6. Different protein expression patterns induced by bisphenol A (BPA) treatment. (A) Western blot analysis of developed and fixed protein patterns. The text at the top shows the protein name and BPA concentration. Protein sizes are shown on the right. (B) The ratio of protein expression was calculated between the control and BPA treatment groups according to the relative expression level. Each difference in protein expression was normalized to that of the 0 μM-BPA treatment group as fold change. The x-axis represents the BPA concentration. Data were statistically analyzed by one-way analysis of variance (ANOVA). ns, no significant difference; *P < 0.05 and **P < 0.01. Data are shown as mean ± standard error of the mean (SEM) (n = 3).
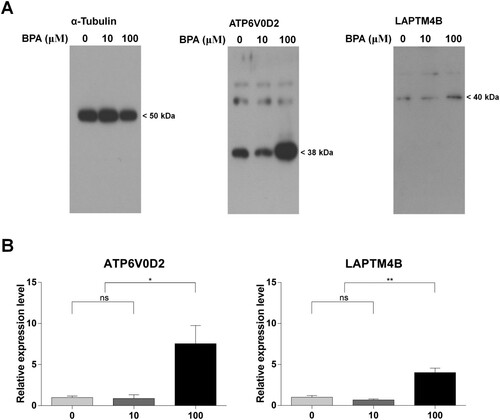
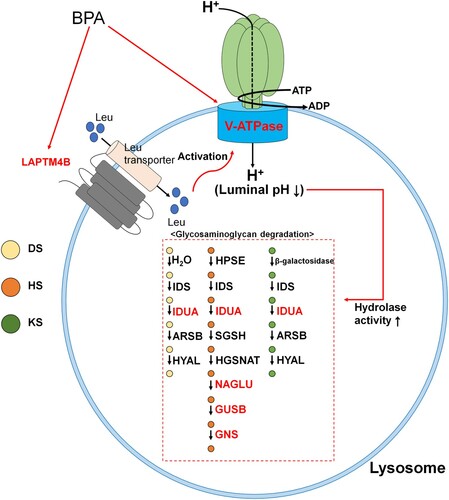
Figure 7. Overall process resulting from bisphenol A (BPA) exposure. Figure represents the cascade of lysosomal processes caused by exposure to BPA. DS; dermatan sulfate, HS; heparan sulfate, KS; keratan sulfate. Red text represents recognized differentially expressed genes (DEGs).