Figures & data
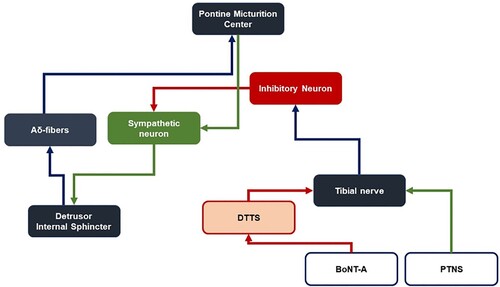
Figure 1. Experimental set-up involving development of cyclophosphamide-induced model, followed by BoNT-A injection and cystometry analysis.
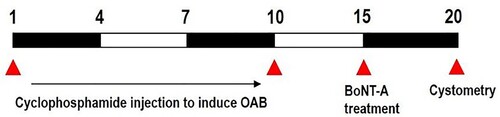
Figure 2. Effects of BoNT-A administration to the tibial nerve perineural space on bladder function through cystometry. Contraction pressure, contraction time, and inter-contraction interval amongst the three experimental groups: A: Control group; B: OAB group; C: Treatment group. *P < .05 compared to the control group. #P < .05 compared to the OAB-induced group.
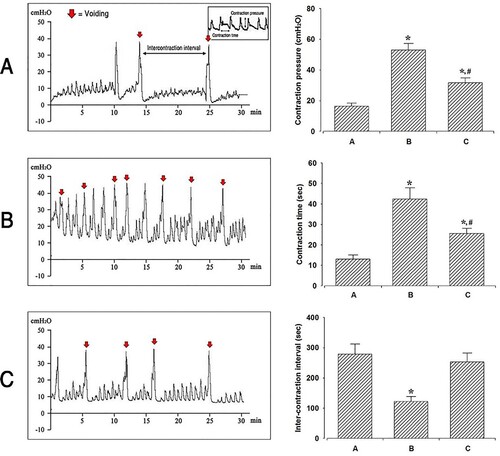
Figure 3. Schematic comparison between the treatment mechanism of the current study and that suggested by DTTS and conventional PTNS.