Figures & data
Figure 1. PGG inhibits Mia-Paca-2 cells proliferation, shows cytotoxic effect and inhibits colony formation of Mia-Paca-2 cells. Cells were treated with indicated the concentrations of PGG for 48, 72, or 96 h. Proliferation (A) and cytotoxicity (B) were determined as indicated in the main text. (C) Cells were treated with PGG at the indicated concentrations for 19 days. Colony formation was determined by crystal violet staining. Visible colonies were photographed and counted. Data are expressed as the mean ± SEM (n = 4). Statistical significance was based on the difference compared with 0 µM PGG by two-way ANOVA followed by the Bonferroni test (*P < 0.05, **P < 0.01, ***P < 0.001).
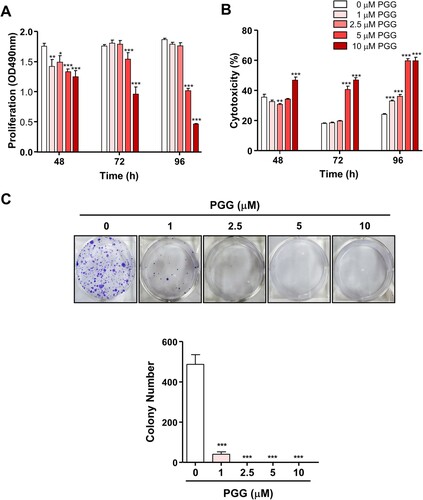
Figure 2. PGG suppresses cell adhesion and migration of Mia-Paca-2 cells. Cells were treated with the indicated concentrations of PGG. Adhesion (A) and migration (B) were determined as described in the main text. Data are expressed as the mean ± SEM (n = 3). Statistical significance was based on the difference compared with 0 µM PGG by one-way ANOVA followed by Dunnett’s test (*P < 0.05, **P < 0.01, ***P < 0.001).
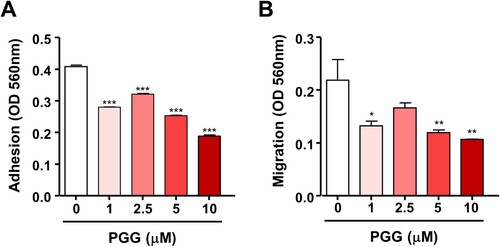
Figure 3. PGG inhibits the expression of CD44, a marker of pancreatic cancer stem cells. Cells were treated with the indicated concentrations of PGG for 72 h. Protein expression levels of CD44s and CD44v3 were determined. Relative values under western blot bands were calculated by dividing the density of CD44s and CD44v3 protein bands by the density of the GAPDH band. The data represent three repeated experiments and are expressed as the mean ± SEM (n = 3). Statistical significance was based on the difference compared with 0 µM PGG by one-way ANOVA followed by Dunnett’s test (*P < 0.05, ***P < 0.001).
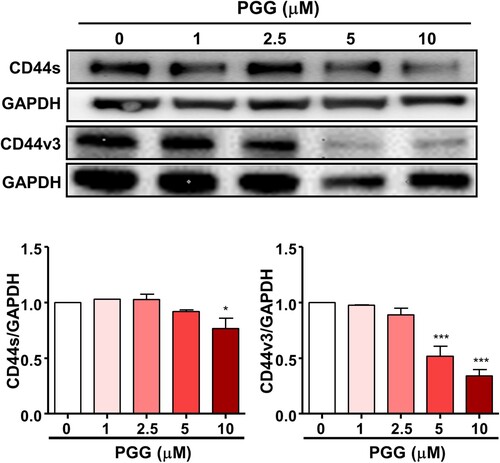
Figure 4. PGG selectively regulates the expression of transcription factors of CD44. Cells were treated with the indicated concentrations of PGG for 48 h. (A) Protein expression levels of NF-κB were assessed in nuclear and cytoplasmic fractions. Relative values under the western blot were calculated by dividing the density of the NF-κB p65 protein band by the density of the GAPDH band in the cytosolic fraction or the density of NF-κB p65 band by that of the Lamin A/C band in the nuclear fraction. (B) The relative value in the western blot was calculated by dividing the band density of the p-p53 protein by the density of the p53 band. (C) Relative values were calculated by dividing the intensity of the Foxo3 band by that of the GAPDH band. The data represent three repeated experiments and are expressed as the mean ± SEM (n = 3). Statistical significance was based on the difference compared with 0 µM PGG by one-way ANOVA followed by Dunnett’s test (*P < 0.05, **P < 0.01, ***P < 0.001).
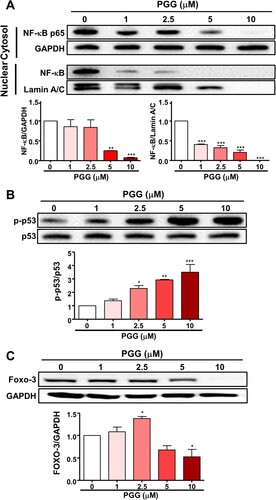
Figure 5. PGG activates the ubiquitin-proteasome system. Cells were treated with PGG at the indicated concentrations for 72 h. (A) Proteasome activity was determined as indicated in the main text. (B) Ubiquitination of CD44v3 was determined by IP. The data represent three repeated experiments and are expressed as the mean ± SEM (n = 3). Statistical significance was based on the difference compared with 0 µM PGG by one-way ANOVA followed by Dunnett’s test (*P < 0.05, **P < 0.01, ***P < 0.001).
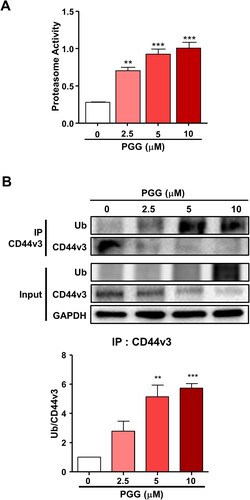
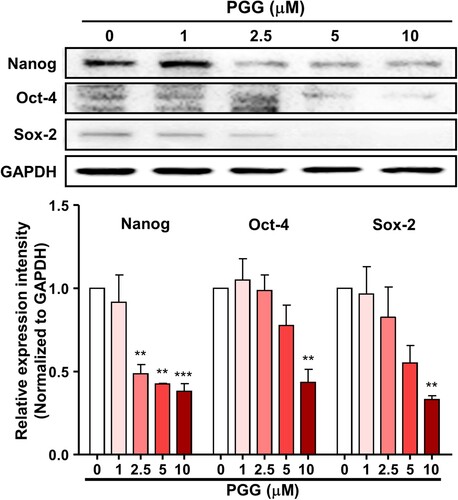
Figure 6. PGG suppresses the expression of CD44-related signaling pathway effectors. Mia-PaCa-2 cells were treated with different concentrations of PGG for 48 h and harvested. The expression of CD44-related proteins was analyzed by western blotting. Relative values under the western blot were calculated by dividing the density of the target protein band by that of the GAPDH band. The data represent three repeated experiments and are expressed as the mean ± SEM (n = 3). Statistical significance was based on the difference compared with 0 µM PGG by one-way ANOVA followed by Dunnett’s test (**P < 0.01, ***P < 0.001).