Figures & data
Table 1. Sequences of the primers.
Figure 1. Effects of TSG treatment on obesity and male infertility. (A) Body weight changes of four groups were monitored once a week for six weeks. (B) The weights of testis and adipose tissues around the epididymis were detected after six weeks. (C) Representative spermatozoon tracks of four groups generated by CASA. Tracks color code: blue-curvilineal moving; green-linearly moving; red-immotile (excluded from analysis); Magnification 400 × . (D) The changes in spermatozoon concentration were evaluated using CASA. (E) The changes in progressive motility (PR, %) and total motility (PR + NP, %) of spermatozoa. (F) HE staining of rat testicular tissues to evaluate morphological changes. Data are expressed as mean ± SD (n = 5). *P < 0.05 vs. Control group, #P < 0.05 vs. HFD + CTX group. HFD, high-fat diet; CTX, Cyclophosphamide; TSG, tortoise-shell glue; PR, progressive motility rate; NP, non-progressive motility rate.
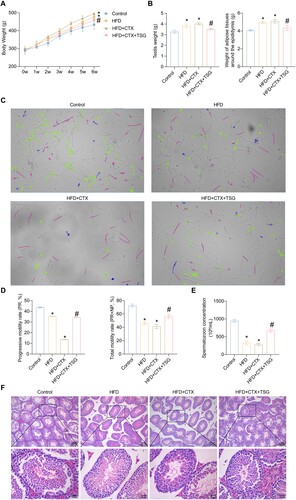
Figure 2. Effects of TSG treatment on HPG axis in obese rats with male infertility. (A) The mRNA levels of GnRH, RFRP-3, and kisspeptin in the hypothalamus tissues of the four groups using qRT-PCR. (B) The mRNA levels of GnRHR, RFRP-3, and kisspeptin in the pituitary tissues of the four groups using qRT-PCR. (C) Expression levels of LH, FSH, PRL, E2, PROG, and T in the serum of the four groups using ELISA. (D) Expression levels of GnRH and leptin in the serum of the four groups using ELISA. Data are expressed as mean ± SD (n = 5). *P < 0.05 vs. Control group, #P < 0.05 vs. HFD + CTX group. HFD, high-fat diet; CTX, Cyclophosphamide; TSG, tortoise-shell glue; GnRH, gonadotropin-releasing hormone; RFRP-3, RF amide-related peptide-3; GnRHR, GnRH receptor; LH, luteinizing hormone; FSH, follicle-stimulating hormone; PRL, prolactin; E2, estradiol; PROG, progesterone; T, testosterone.
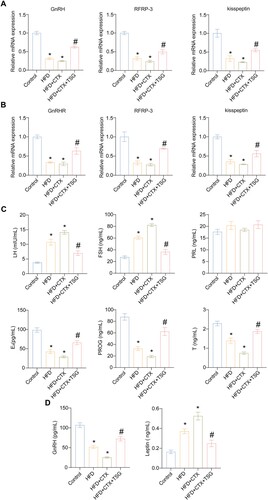
Figure 3. Changes in the serum metabolomics profiles of four groups. (A) PCA model was used to distinguish the difference between groups. (B) Volcano plots showing trends in metabolite expression differences. (C) The heat map of potential metabolites from four groups. HFD, high-fat diet; CTX, Cyclophosphamide; TSG, tortoise-shell glue.
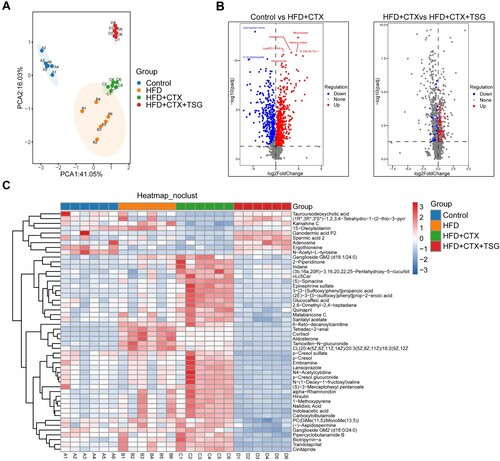
Figure 4. The relative content changes of serum metabolites. Bar graph of intergroup abundance variation of 16 differential metabolites. Data are expressed as mean ± SD (n = 6). *P < 0.05 vs. Control group, #P < 0.05 vs. HFD + CTX group. HFD, high-fat diet; CTX, Cyclophosphamide; TSG, tortoise-shell glue.
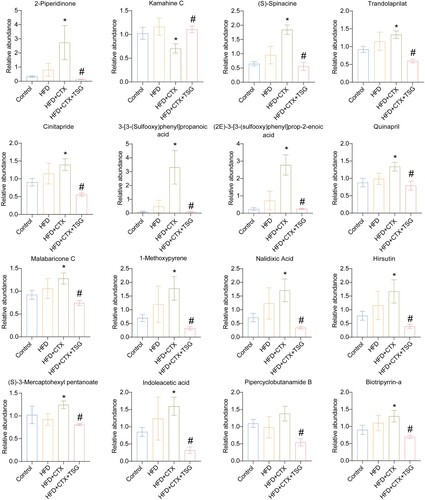
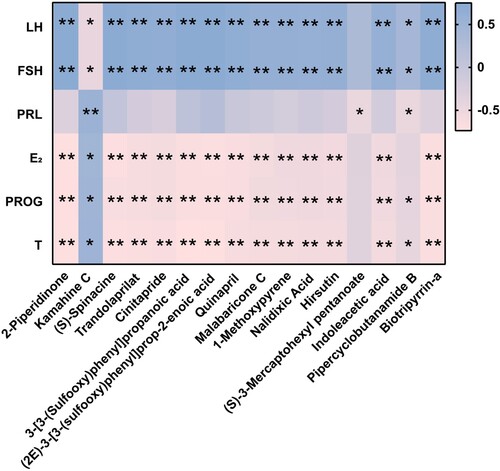
Figure 5. The Spearman correlation between the differential metabolites and levels of sex hormones. The color blue is used to represent a positive correlation, while the color pink is used to represent a negative correlation. The intensity of the color is directly proportional to the magnitude of the Spearman correlation. *P < 0.05, **P < 0.01.