Figures & data
Table 1. Classification of dendritic protrusion morphology using Imaris 10.1.0.
Figure 1. Dendritic morphology of CA1 pyramidal neurons in 17-month-old Cyfip2 cKO mice. (A) Representative confocal images of CYFIP2, YFP, and NeuN immunofluorescent staining in the hippocampal CA1 region of 17-month-old control (Cyfip2floxed/floxed;Thy1-YFP) and Cyfip2 cKO (Cyfip2floxed/floxed;CaMKIIα-Cre;Thy1-YFP) mice. Quantification of CYFIP2 mean intensity in the stratum pyramidale (SP) layer. CA, cornu ammonis; DG, dentate gyrus; SO, stratum oriens; SR, stratum radiatum. Scale bar, 100 μm. (B) Representative dendritic morphologies (traced by Imaris) of CA1 pyramidal neurons in 17-month-old control and Cyfip2 cKO mice. Scale bar, 40 μm. Quantification of Sholl analysis (for total, basal, and apical dendrites). (C) Quantification of dendritic branch points. (D) Quantification of dendritic length. N = 10 neurons per genotype.
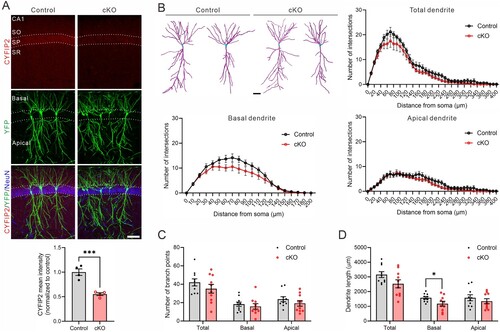
Figure 2. Dendritic protrusion density and morphology in CA1 pyramidal neurons of 17-month-old Cyfip2 cKO mice. (A) Representative confocal images of dendritic protrusions and their Imaris classifications (blue for mushroom spine, red for stubby spine, yellow for filopodia) in both basal and apical dendrites of CA1 pyramidal neurons of 17-month-old control and Cyfip2 cKO mice. Scale bar, 2 μm. (B) Quantification of dendritic protrusion density in the basal (left panel) and apical (right panel) dendrites. (C) Quantification of dendritic protrusion length in the basal and apical dendrites. (D) Quantification of dendritic protrusion head volume in the basal and apical dendrites. (E) Quantification of dendritic protrusion total volume in the basal and apical dendrites. N = 20 neurons per genotype.
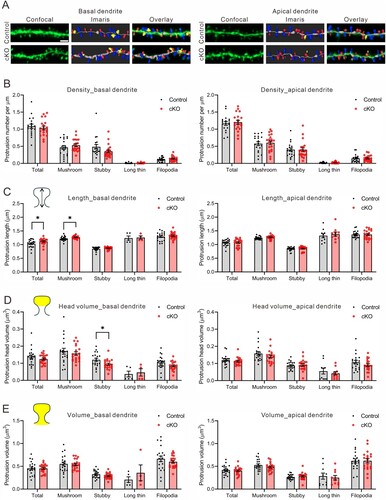
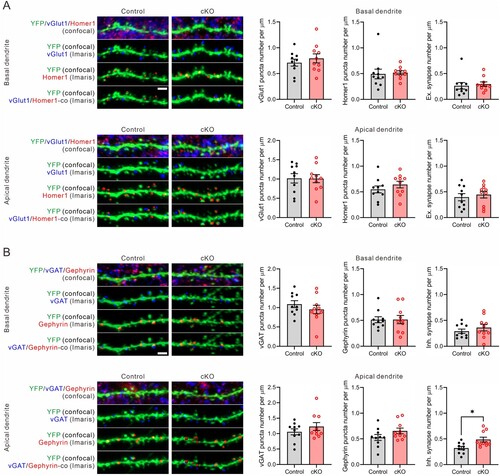
Figure 3. Excitatory and inhibitory synaptic densities in CA1 pyramidal neurons of 17-month-old Cyfip2 cKO mice. (A) Representative confocal images of excitatory synapses and their Imaris detections in both basal (upper panels) and apical (lower panels) dendrites of CA1 pyramidal neurons of 17-month-old control and Cyfip2 cKO mice. co, colocalization; Ex., excitatory. Scale bar, 2 μm. Quantifications of densities of pre – (vGlut1) and post – (Homer1) synaptic markers and their colocalizations. (B) Representative confocal images of inhibitory synapses and their Imaris detections in both basal and apical dendrites of CA1 pyramidal neurons of 17-month-old control and Cyfip2 cKO mice. Inh., inhibitory. Scale bar, 2 μm. Quantifications of densities of pre – (vGAT) and post – (Gephyrin) synaptic markers and their colocalizations. N = 10 neurons per genotype.