
Figures & data
Table 1. Comparison of group M and group C based on demographic parameters and surgical interventions characteristics.
Figure 1. Changes, in systolic arterial blood pressure, related to music therapy. Group M: music intervention; Group C: control group.
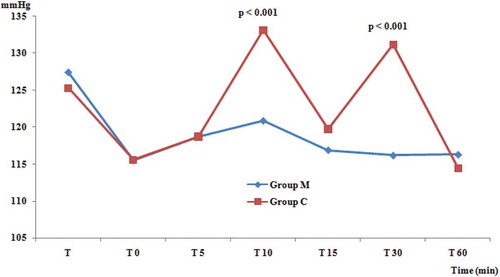
Table 2. Effects of music therapy on recovery quality, VAS during recovery, patient satisfaction and intraoperative awareness.