773
Views
2
CrossRef citations to date
0
Altmetric
Original Article

Nitrite enhances liver graft protection against cold ischemia reperfusion injury through a NOS independent pathway

ORCID Icon, , , , , & show all
Article: 1308780 | Received 21 Dec 2016, Accepted 12 Mar 2017, Published online: 30 Mar 2017

Figures & data

Figure 1. Alanine aminotransferase (ALT) and aspartate aminotransferase (AST) activities in liver effluent obtained after 24 h of cold preservation (a, b). Livers’ rat (n = 6) were flushed and preserved in IGL-1 solution (4°C for 24 h) supplemented with 50 nM of nitrite or with 50 nM of nitrite + 1 mM of L-NAME (L-NG-Nitroarginine methyl ester). Sham: livers were flushed and perfused ex vivo without cold storage. Data are expressed as means ± SE (n = 6 for each group). a: p < 0.05 vs Sham; b: p < 0.05 vs IGL-1.
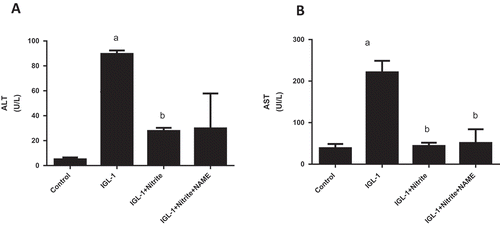
Figure 1. Alanine aminotransferase (ALT) and aspartate aminotransferase (AST) activities in liver effluent obtained after 24 h of cold preservation (a, b). Livers’ rat (n = 6) were flushed and preserved in IGL-1 solution (4°C for 24 h) supplemented with 50 nM of nitrite or with 50 nM of nitrite + 1 mM of L-NAME (L-NG-Nitroarginine methyl ester). Sham: livers were flushed and perfused ex vivo without cold storage. Data are expressed as means ± SE (n = 6 for each group). a: p < 0.05 vs Sham; b: p < 0.05 vs IGL-1.
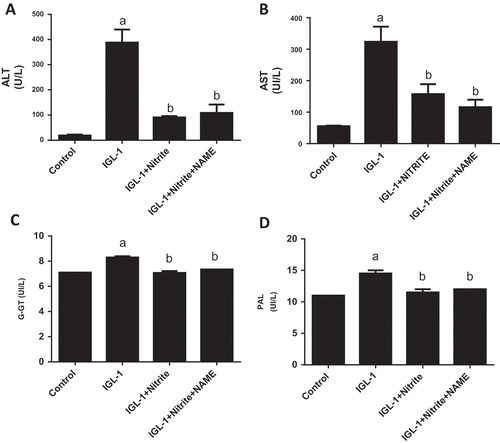
Figure 2. Alanine aminotransferase (ALT) and aspartate aminotransferase (AST) activities in liver effluent obtained after 24 h of cold preservation and 120 min of normothermic reperfusion (a, b), Gamma-glutamyl transferase (G-GT) (c), and alkaline phosphatase (PAL) (d) after of normothermic reperfusion. Livers’ rat (n = 6) were flushed and preserved in IGL-1 solution (4°C for 24 h) supplemented with 50 nM of nitrite or with 50 nM of nitrite + 1 mM of L-NAME (L-NG-Nitroarginine methyl ester). Sham: livers were flushed and perfused ex vivo without cold storage. Data are expressed as means ± SE (n = 6 for each group). a: p < 0.05 vs Sham; b: p < 0.05 vs IGL-1.
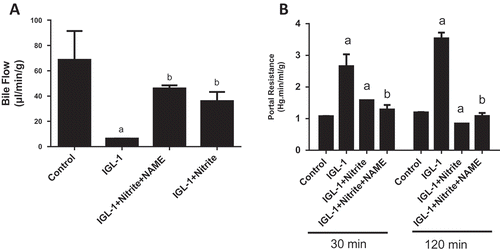
Figure 2. Alanine aminotransferase (ALT) and aspartate aminotransferase (AST) activities in liver effluent obtained after 24 h of cold preservation and 120 min of normothermic reperfusion (a, b), Gamma-glutamyl transferase (G-GT) (c), and alkaline phosphatase (PAL) (d) after of normothermic reperfusion. Livers’ rat (n = 6) were flushed and preserved in IGL-1 solution (4°C for 24 h) supplemented with 50 nM of nitrite or with 50 nM of nitrite + 1 mM of L-NAME (L-NG-Nitroarginine methyl ester). Sham: livers were flushed and perfused ex vivo without cold storage. Data are expressed as means ± SE (n = 6 for each group). a: p < 0.05 vs Sham; b: p < 0.05 vs IGL-1.
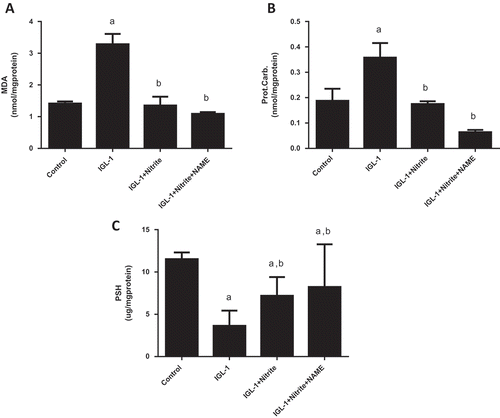
Figure 3. Bile output (a) and portal resistance (b), after 120 min of normothermic reperfusion. Livers’ rat (n = 6) were flushed and preserved in IGL-1 solution (4°C for 24 h) supplemented with 50 nM of nitrite or with 50 nM of nitrite + 1 mM of L-NAME (L-NG-Nitroarginine methyl ester). Sham: livers were flushed and perfused ex vivo without cold storage. Data are expressed as means ± SE (n = 6 for each group). a: p < 0.05 vs Sham; b: p < 0.05 vs IGL-1.
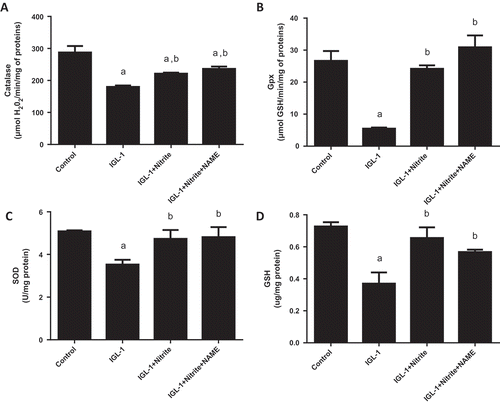
Figure 3. Bile output (a) and portal resistance (b), after 120 min of normothermic reperfusion. Livers’ rat (n = 6) were flushed and preserved in IGL-1 solution (4°C for 24 h) supplemented with 50 nM of nitrite or with 50 nM of nitrite + 1 mM of L-NAME (L-NG-Nitroarginine methyl ester). Sham: livers were flushed and perfused ex vivo without cold storage. Data are expressed as means ± SE (n = 6 for each group). a: p < 0.05 vs Sham; b: p < 0.05 vs IGL-1.

Figure 4. Lipid peroxidation expressed as malondialdehyde (MDA) activity (a), carbonyl proteins (Prot Carb) (b), and sulfhydryl proteins (PSH) levels (c) in liver tissues after normothermic reperfusion. Livers’ rat (n = 6) were flushed and preserved in IGL-1 solution (4°C for 24 h) supplemented with 50 nM of nitrite or with 50 nM of nitrite + 1 mM of L-NAME (L-NG-Nitroarginine methyl ester). Sham: livers were flushed and perfused ex vivo without cold storage. Data are expressed as means ± SE (n = 6 for each group). a: p < 0.05 vs Sham; b: p < 0.05 vs IGL-1.

Figure 4. Lipid peroxidation expressed as malondialdehyde (MDA) activity (a), carbonyl proteins (Prot Carb) (b), and sulfhydryl proteins (PSH) levels (c) in liver tissues after normothermic reperfusion. Livers’ rat (n = 6) were flushed and preserved in IGL-1 solution (4°C for 24 h) supplemented with 50 nM of nitrite or with 50 nM of nitrite + 1 mM of L-NAME (L-NG-Nitroarginine methyl ester). Sham: livers were flushed and perfused ex vivo without cold storage. Data are expressed as means ± SE (n = 6 for each group). a: p < 0.05 vs Sham; b: p < 0.05 vs IGL-1.

Figure 5. Evaluation of antioxidant enzymes catalase (CAT) (a), glutathione peroxidase (GPX) (b), superoxide dismutase (SOD) (c), reduced gluthatione (GSH) (d) activities. Livers’ rat (n = 6) were flushed and preserved in IGL-1 solution (4°C for 24 h) supplemented with 50 nM of nitrite or with 50 nM of nitrite + 1 mM of L-NAME (L-NG-Nitroarginine methyl ester). Sham: livers were flushed and perfused ex vivo without cold storage. Data are expressed as means ± SE (n = 6 for each group). a: p < 0.05 vs Sham; b: p < 0.05 vs IGL-1.

Figure 5. Evaluation of antioxidant enzymes catalase (CAT) (a), glutathione peroxidase (GPX) (b), superoxide dismutase (SOD) (c), reduced gluthatione (GSH) (d) activities. Livers’ rat (n = 6) were flushed and preserved in IGL-1 solution (4°C for 24 h) supplemented with 50 nM of nitrite or with 50 nM of nitrite + 1 mM of L-NAME (L-NG-Nitroarginine methyl ester). Sham: livers were flushed and perfused ex vivo without cold storage. Data are expressed as means ± SE (n = 6 for each group). a: p < 0.05 vs Sham; b: p < 0.05 vs IGL-1.