Figures & data
Figure 1. Schematic representation of the measurements of positions and angles of an ultrasonic transducer (UT) on the closed eyelid. (a) Example of the relative positions of the UT of 14 mm in diameter on the closed eyelid in the case of the identified edge of the internal carotid artery (red circle on the right eye) and the depth of intracranial segment of ophthalmic artery selected simultaneously with the depth of the extracranial segment of the ophthalmic artery (green circle on the right eye). The average adult human orbit geometry (height and width) is depicted on the left eye. (b) Schematic representation of the head frame top view used for UT positioning and orientation. Angle alpha, which was measured between the longitudinal axis of the UT (red dashed line) and the frontal axis of a human head (blue solid line), is depicted. (c) Schematic representation of the head frame sideview used for UT positioning and orientation. Angle beta, which was measured between the longitudinal axis of the UT (red dashed line) and the vertical axis of a human head (blue solid line), is depicted.
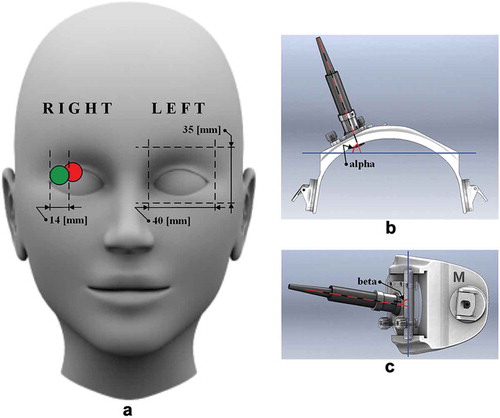
Table 1. Depth and distance data of the located edge of the internal carotid artery and segments of ophthalmic artery in high tension glaucoma patients.
Table 2. Depth and distance data of the located edge of the internal carotid artery and segments of the ophthalmic artery in healthy volunteers.
Figure 2. Distribution graphs of (a) identified depths of the internal carotid artery (ICA) edge (b) depths of the intracranial segment of the ophthalmic artery (IOA) selected simultaneously with the extracranial segment of the ophthalmic artery (EOA). Data collected on 25 high tension glaucoma patients (14 right eyes and 19 left eyes) and 23 healthy volunteers (20 right eyes and 13 left eyes) are included.
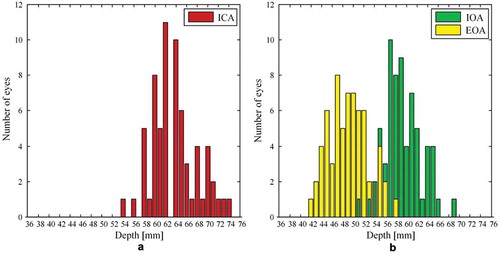
Figure 3. Distribution graphs of (a) distances between the identified edge of the internal carotid artery (ICA) and the selected depth of the intracranial segment of the ophthalmic artery (IOA) (ICA-IOA) (b) distances between the selected depth of the IOA and the extracranial segment of the ophthalmic artery (EOA) (IOA-EOA). Data collected on 25 high tension glaucoma patients (14 right eyes and 19 left eyes) and 23 healthy volunteers (20 right eyes and 13 left eyes) are included.
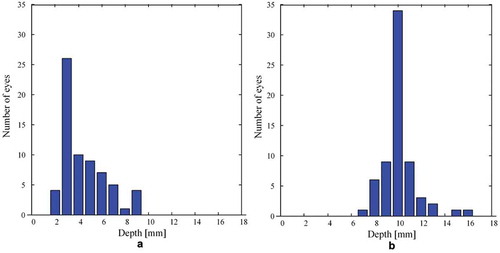
Table 3. Angles of the ultrasonic transducer on the closed eyelid in the case of the identified edge of the ICA and IOA segment selected simultaneously with the EOA in healthy volunteers.
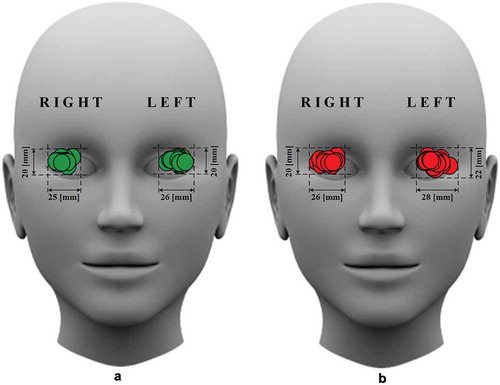
Figure 4. Relative positions of the ultrasonic transducer (UT) on the closed eyelid in the case of the located (a) intracranial segment of the ophthalmic artery simultaneously selected with the extracranial segment of the ophthalmic artery and (b) edge of the internal carotid artery. The width and height of the window within which the UT surface falls are indicated in millimetres.