
Figures & data
Table 1. Primer names, sequences, and annealing temperatures used in PCR amplification of the NAT2 gene.
Table 2. Distribution of NAT2 genetic variants among the healthy Jordanian population (n = 68).
Table 3. Distribution of NAT2 genotype among the healthy Jordanian population (n = 68).
Table 4. Comparison of NAT2 genetic allele frequencies among the Jordanian population with other major ethnic populations.
Table 5. NAT2 haplotype among the healthy unrelated Jordanian population (n = 68).
Table 6. Predicted acetylation phenotype among the healthy unrelated Jordanian population (n = 68).
Figure 1. Gel electrophoresis of the PCR products of NAT2 gene. The NAT2 gene sequence was amplified by two PCR reactions represented by the first fragment (A) and second fragment (B).
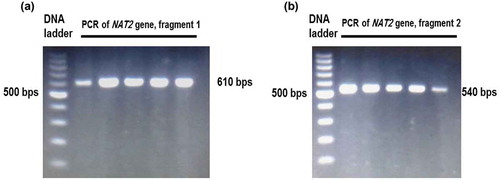
Figure 2. Linkage disequilibrium (LD) of NAT2 genetic variants found among Jordanian volunteers. The LD was carried out using Haploview software. The red squares represent a strong LD, and the white square represents a weak LD. The blue square indicates that there is no LD. Only genetic variants with a frequency higher than 5% were used for identification of LD.
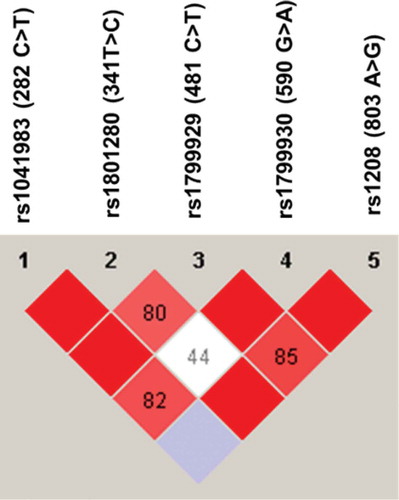
Figure 3. Chromatogram of DNA sequencing of the novel NAT2 436G>A genetic variant. The NAT2 436G>A was identified in only one Jordanian volunteer with a heterozygote genotype.
Figure 4. Alignment of NAT2 polypeptide sequences for different species. The alignment was carried out using Multialign software (Corpet, F. 1998). The NAT2 amino acid sequences of the different species were obtained from the PubMed amino acid sequence bank. Further information is provided in the Materials and methods section.
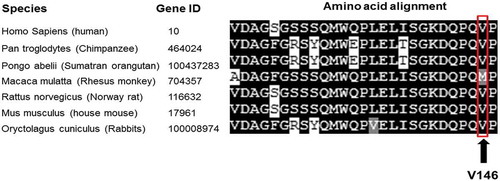
Figure 5. Visualization of wild-type and mutated NAT2 proteins. (A) shows the location of the novel mutated residue VAL146MET in the predicted model structure of NAT2 protein.
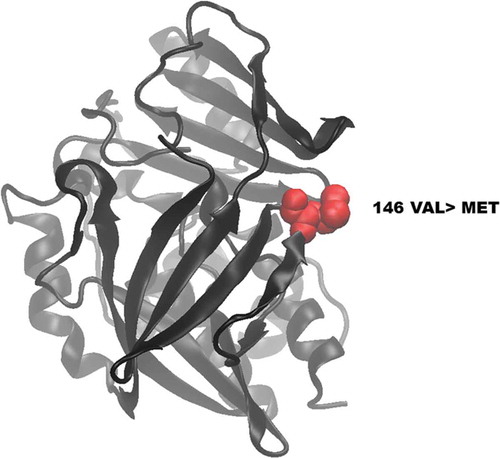
Table 7. In silico prediction of the effect of novel NAT2 genetic variant by using Polyphen2, SIFT, and MutPred software programs.