Figures & data
Table 1. Demographic and baseline characteristics of chronic hepatitis C patients.
Table 2. Baseline metabolic data and lipid profile in chronic hepatitis C (CHC) patients versus the control group.
Table 3. Metabolic factors, lipid profile, according to fibrosis stage in chronic hepatitis C patients.
Table 4. Changes in laboratory data and imaging before and at the end of treatment with SOF/SIM (12 months) in CHC patients.
Table 5. Changes of metabolic factors, lipid profile before and after the end of treatment of SOF/SIM treatment (12 weeks) in CHC patients.
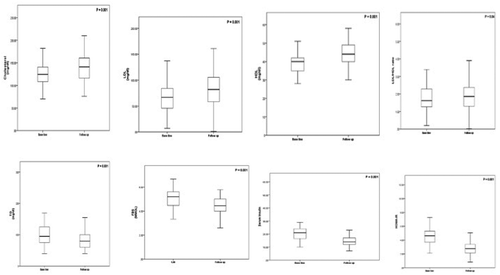
Figure 1. Changes in lipid profile, FBS, fasting insulin, and HOMA-IR in 80 chronic hepatitis C patients before and at the end of treatment with SOF/SIM. The charts show the changes in lipid profile, FBS, fasting insulin, and HOMA-IR in chronic hepatitis C (HCV) patients before and at the end of treatment (12 weeks) with SOF/SIM. LDL-c: low-density lipoprotein cholesterol; HDL: high-density lipoprotein cholesterol; TG: triglycerides; FBS: fasting blood sugar.

Table 6. Factors associated with ΔLDL-C value with HCV administered SOF/SIM regimen, analyzed by multiple logistic-regression analysis.
