Figures & data
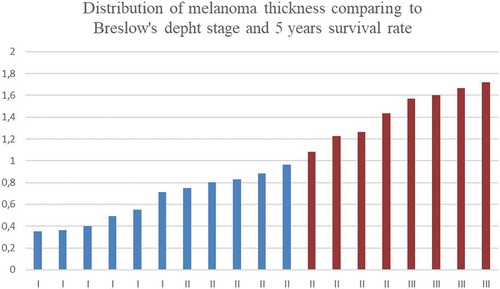
Figure 1. Distribution of melanoma thickness comparing to Breslow’s depth stage and 5 years survival rate.
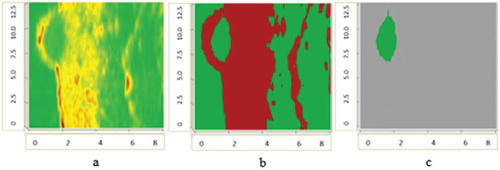
Figure 2. Ultrasonic B-scan images (raw and processed) of skin melanoma, axes are in millimetres: a – ultrasonic raw B-scan image, b – binary B-scan image, c – detected informative region.
Figure 3. Digital Dermatoscopy Images (raw and processed) of skin melanoma, axes are in millimetres: a – raw optical image, b – binary optical image, c – detected informative region.
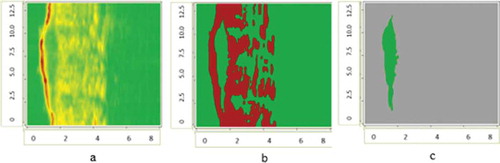
Figure 4. Ultrasonic B-scan images (raw and processed) of benign nevus, axes are in millimetres: a – ultrasonic raw B-scan image, b – binary B-scan image, c – detected informative region.
Figure 5. Digital dermatoscopy images (raw and processed) of benign nevus, axes are in millimetres: a – raw optical image, b – binary optical image, c – detected informative region.
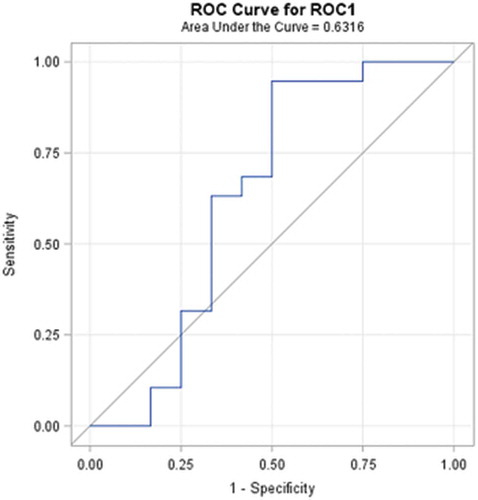
Table 1. Significant parameters evaluated from detected skin lesion region of ultrasonic and dermatoscopic images.
Figure 6. ROC curve of the classification of melanoma and benign melanocytic nevi analysing ultrasonic B-scan images only by using discriminant analysis.
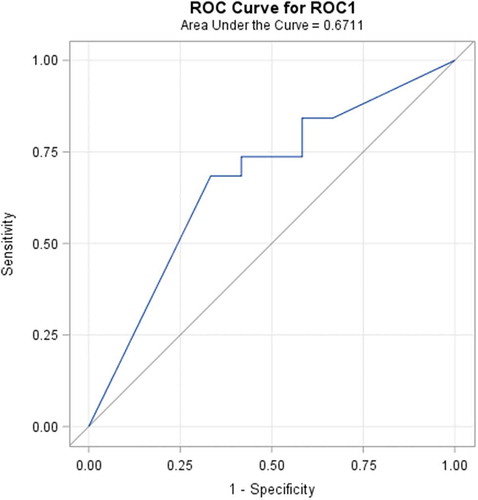
Figure 7. ROC curve of indirectly combined digital dermatoscopy and ultrasonic B-scan images classification by using discriminant analysis.
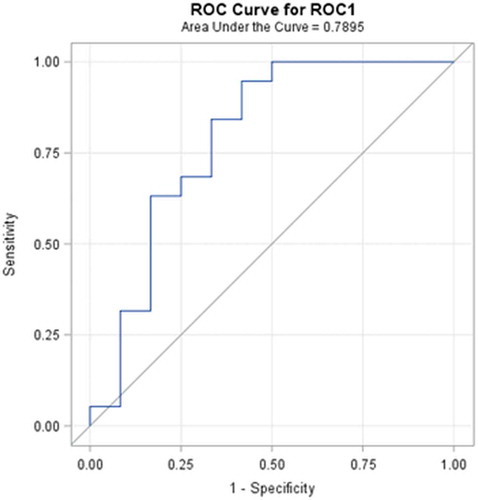
Figure 8. ROC curve of the classification of melanoma and benign melanocytic nevi analysing ultrasonic B-scan images only by using logistic regression.
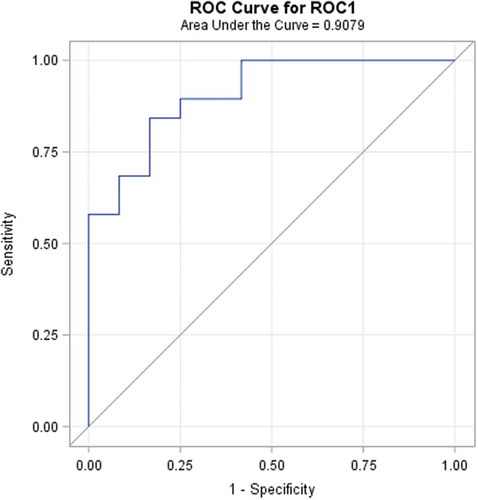
Figure 9. ROC curve of indirectly combined digital dermatoscopy and ultrasonic medical images classification by using logistic regression.
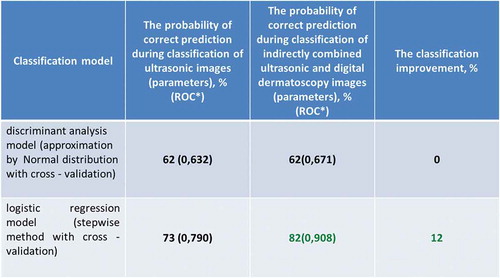
Figure 10. The results of classification of melanoma and benign melanocytic nevi analysing ultrasonic B-scan images and in combination with analysis of digital dermatoscopy images.