Figures & data
Figure 1. Impact of Tau on apoptosis of Caco-2 and SW620. After Caco-2 and SW620 were added varying levels of Tau and DDP (5 μg/mL) for 48 h, respectively, Tau with concentration more than 80 mM can significantly induce the apoptosis of Caco-2 and SW620. **P < 0.01 vs. Control.
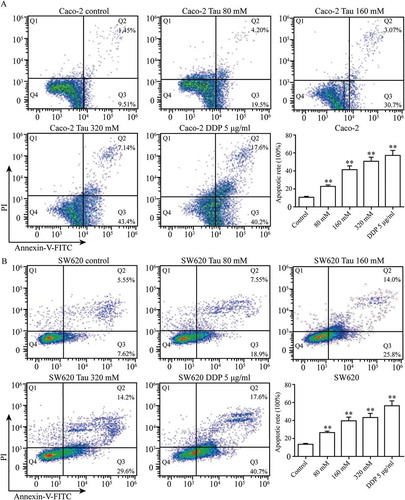
Figure 2. Impact of Tau on Mst1, JNK, and p-JNK proteins in Caco-2 and SW620. (A) In Caco-2, the protein expressions of Mst1 and p-JNK increased gradually with the increase of the Tau concentration. (B) In SW620, Tau had no significant impact on the protein expressions of Mst1, JNK, and p-JNK in SW620. **P < 0.01 and *P < 0.05 vs. Control.
Figure 3. Impact of Mst1 and Tau (160 mM) on proliferation and apoptosis of Caco-2 and SW620. The high expression of Mst1 alone or in combination with Tau can greatly improve the proliferation inhibitory (A) and apoptosis rate (B, C) in both Caco-2 and SW620. The Q2 (AnnexinV+ PI+) indicates the late stage for cell death and Q3 (Annexin+PI-) presents the early stage for cell. **P < 0.01 vs. group p-EGFP-NC; #P < 0.05 vs. group p-EGFP-Mst1.
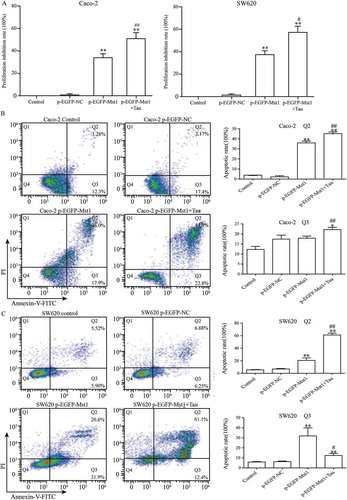
Figure 4. Fluorescence microscopic (at 200× magnification) study of apoptosis in both Caco-2 and SW620 cells using Hoechst 33342 staining dye. The high expression of Mst1 alone or in combination with Tau can greatly improve the apoptosis rate in both Caco-2 and SW620. **P < 0.01 vs. group p-EGFP-NC; ##P < 0.01 vs. group p-EGFP-Mst1.
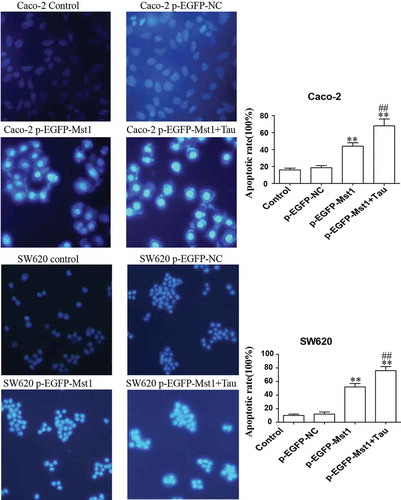
Figure 5. Impact of Mst1 and Tau on JNK, p-JNK, Bax, and Bcl-2 proteins in CRCs. The protein levels of Mst1, JNK, p-JNK, and Bax of Caco-2 and SW60 were significantly upregulated but Bcl-2 was downregulated in both group p-EGFP-Mst1 and p-EGFP-Mst1+ Tau. *P < 0.05, **P < 0.01 vs group Control or p-EGFP-NC; #P < 0.05, ##P < 0.01 vs group p-EGFP-Mst1.
Figure 6. Impact of silencing Mst1 on Tau-promoted apoptosis of CRCs. The apoptotic rates of the Caco-2 and SW620 were significantly decreased in group siRNA-Mst1 but increased in group siRNA-Mst1+ Tau. The Q2 (AnnexinV+ PI+) indicates the late stage for cell death and Q3 (Annexin+ PI-) presents the early stage for cell. *P < 0.05, **P < 0.01 vs group Control or siRNA-NC; ##P < 0.01 vs group siRNA-Mst1.
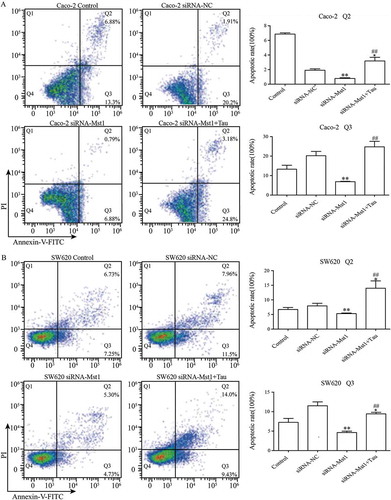
Figure 7. Fluorescence microscopic (at 400× magnification) study of apoptosis in both Caco-2 and SW620 cells using Hoechst 33342 staining dye. The apoptotic rates of the Caco-2 and SW620 were significantly decreased in group siRNA-Mst1 but increased in group siRNA-Mst1+ Tau. **P < 0.01 vs group Control or siRNA-NC; ##P < 0.01 vs group siRNA-Mst1.
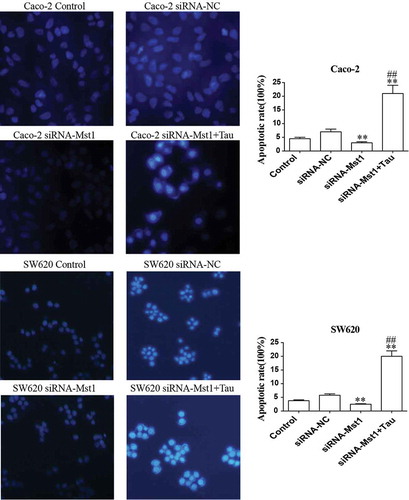
Figure 8. Impact of silencing Mst1 on apoptosis-related proteins in Tau-regulated CRCs. In contrast to group siRNA-Mst1, the protein expression of Bax increased and Bcl-2 decreased significantly in group siRNA-Mst1+ Tau in both Caco-2 and SW620. *P < 0.05, **P < 0.01 vs group Control or siRNA-NC; #P < 0.05, ##P < 0.01 vs group siRNA-Mst1.
Figure 9. Impact of JNK inhibitor on apoptosis-related proteins in Tau-regulated CRCs. Compared to the group SP600125, the expressions of JNK, p-JNK, and Bax were increased and Bcl-2 decreased in group SP600125+ Tau and SP600125 + p-EGFP-Mst1 of Caco-2 and SW620. **P < 0.01 vs group DMSO or Control; ##P < 0.01 vs SP600125.