Figures & data
Figure 1. Human Corneal cell construct.
Table 1. Size distribution and Zeta Potential measurement of SLN-NAC.
Figure 2. TEM micrographs of SLN-NAC.
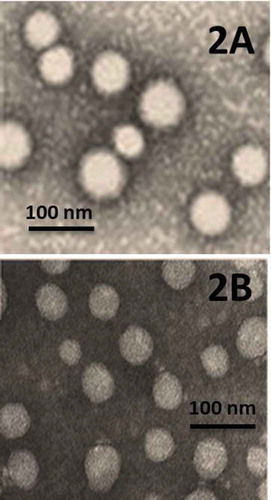
Table 2. Percentage of drug loading SLN and the percentage of entrapment of drug in the SLN-NAC.
Figure 3. in-vitro release profile of SLN-NAC.
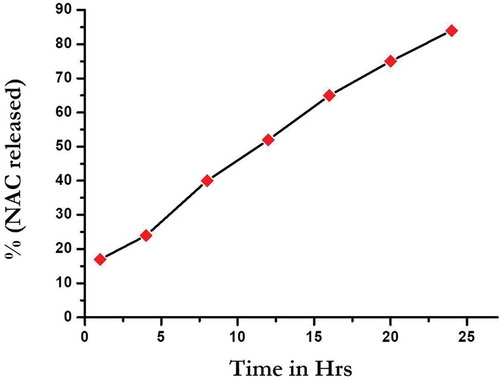
Figure 4. FTIR spectra of NAC and SLN-NAC.
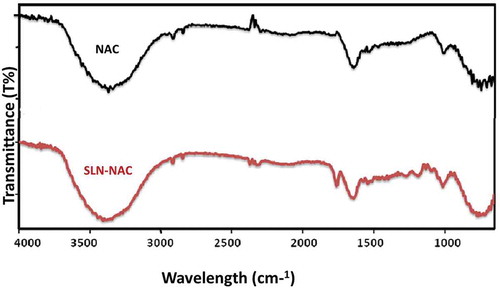
Figure 5. Impedance profiles of Normal HENC cells, SLN-NAC treated HENC cells, Free NAC treated HENC cells and cataract induced HENC cells.
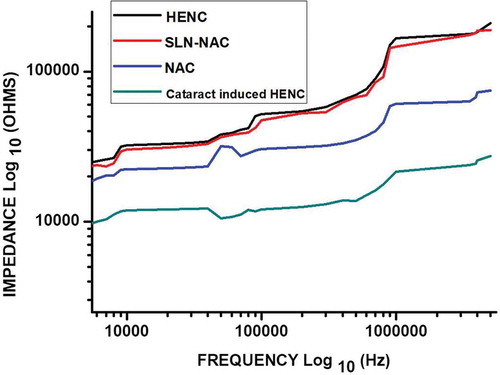
Figure 6. Percentage of SLN-NAC and NAC permeation in human corneal construct.
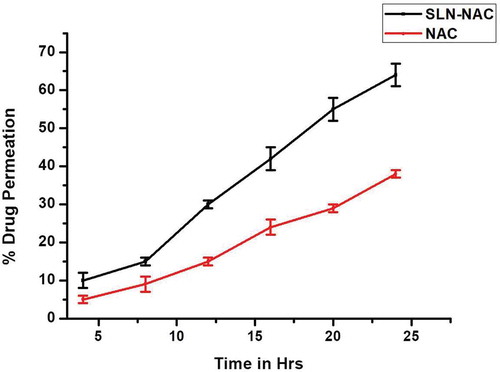
Figure 7. (A) Drug permeation of SLN-NAC; (B) Drug permeation of NAC in human corneal construct.
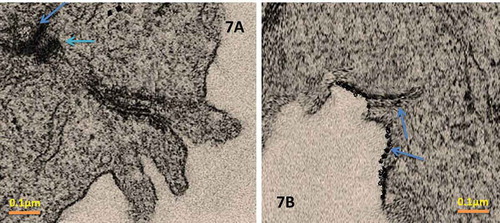
Figure 8. Corneal hydration % of SLN-NAC treated and Free NAC treated Cornea.
Figure 9. Cytotoxicity of PBS (control), NAC and SLN-NAC.