
Figures & data
Table 1. Effectiveness of hepatitis B vaccine according to the two protocols, Monastir, Tunisia 2000–2017.
Table 2. Effectiveness of HB vaccine (Monastir (2000–2017)).
Figure 1. Age distribution of cases of hepatitis B according to immunization status (2000–2017; Monastir Tunisia).
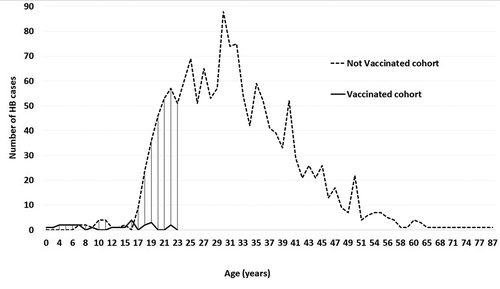
Table 3. Absolute risk of developing HB, by delegations (Monastir; Tunisia, 2000–2017).
Table 4. Absolute risk and trends of HB, by age groups and gender (Monastir, Tunisia, 2000–2017).
Figure 2. Trends of hepatitis B crude incidence rate/100,000 inh according to immunization status (2000–2017; Monastir Tunisia).
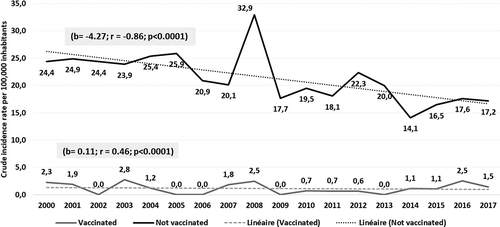
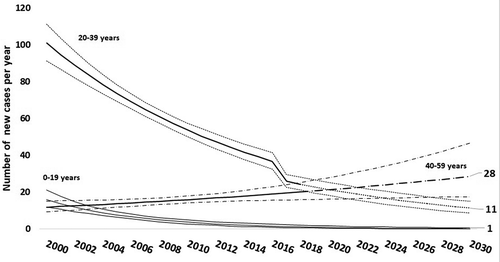
Figure 3. Prediction to 2030 of cases of hepatitis B according to age group.
Availability of data and materials
All data generated or analyzed during this study are included in this published article.
Competing interests No Competing interests for all authors.