
Figures & data
Table 1. Characteristics and laboratory data of the study groups.
Figure 1. Association of vascular endothelial growth factor protein levels with CKD risk. CKD: chronic kidney disease; SD: standard deviation; Total: the total number of CKD group or control group; CI: confidence intervals; I2: test the heterogeneity among recruited studies; df: degrees of freedom.
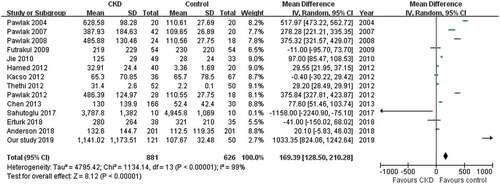
Figure 2. Association of vascular endothelial growth factor protein levels with early- or severe-CKD risk. CKD: chronic kidney disease; SD: standard deviation; Total: the total number of CKD group or control group; CI: confidence intervals; I2: test the heterogeneity among recruited studies; df: degrees of freedom.
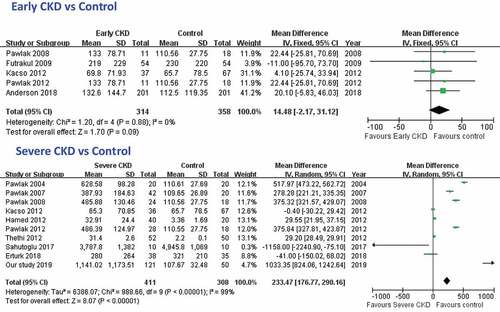
Figure 3. Association of the VEGF +936C/T gene polymorphism with CKD susceptibility. CKD: chronic kidney disease; SD: standard deviation; Total: the total number of CKD group or control group; CI: confidence intervals; I2: test the heterogeneity among recruited studies; df: degrees of freedom.
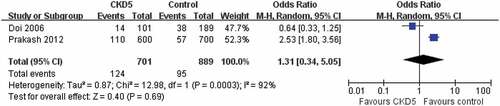
Figure 4. Publication bias was evaluated for association of vascular endothelial growth factor protein levels with chronic kidney disease risk. SMD, standardized mean difference; SE, standard error.
Data availability statement
All data generated of this study are included in the published article. The data used in this study are available on request from the corresponding author.