
Figures & data
Table 1. Demographic characteristics of enrolled participants.
Figure 1. A. Comparison of serum YKL-40 levels between GD patients and healthy control B. Correlation of serum YKL-40 levels with serum FT3 levels C. Correlation of serum YKL-40 levels with serum FT4 levels D. Correlation of serum YKL-40 levels with serum TSH levels.
Figure 2. A. Comparison of serum YKL-40 levels between among patients with different goiter degrees B. Correlation of serum YKL-40 levels with goiter degree.
Figure 3. A. ROC curve analysis of serum YKL-40 levels with regard to goiter degree 0 v 1 B. ROC curve analysis of serum YKL-40 levels with regard to goiter degree 1 vs 2 C. ROC curve analysis of serum YKL-40 levels with regard to goiter degree 2 vs 3.
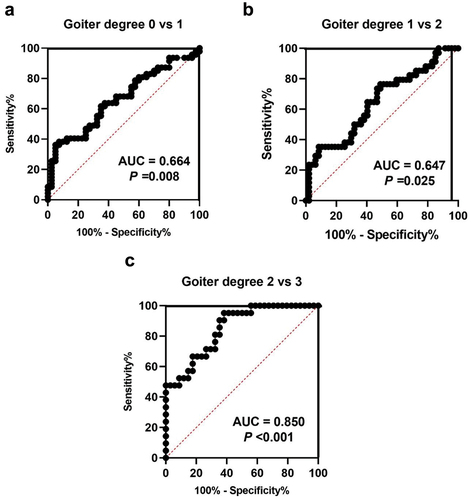
Figure 4. A. Correlation of serum YKL-40 levels with average STV in GD patients B. Correlation of serum YKL-40 levels with average TBF in GD patients.
Table 2. Clinical parameters of the GD patients after methimazole administration.