
Figures & data
Figure 1. Light microscopic view of liver tissue of group C; normal liver tissue (HL: hepatic lobules; VC: vena centralis; k: kupffer cell hyperplasia; *: sinusoid dilatation; ↓↓: infiltration; →: hepatocyte; c: dikaryotic hepatocytes; e: erythrocyte), H&EX100.
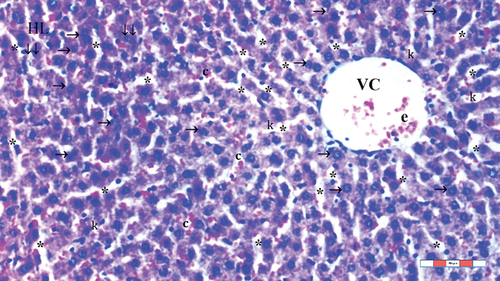
Figure 2. Light microscopic view of liver tissue of group FC60; normal liver tissue (HL: hepatic lobules; VC: vena centralis; e: erythrocyte; con: congestion; *: sinusoid dilatation; →: hepatocyte; c: dikaryotic hepatocytes; ↓↓: infiltration), H&EX100.
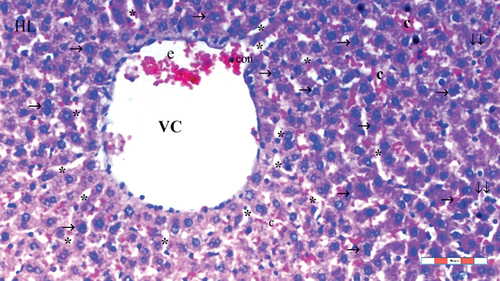
Figure 3. Light microscopic view of liver tissue of group IR (HL: hepatic lobules; VC: vena centralis; e: erythrocyte; con: congestion; *: sinusoid dilatation; ↓↓: infiltration; dikaryotic hepatocytes; inf: inflammation; (*): necrotic and apoptotic appearance in hepatocytes; dej: hydrophilic degeneration), H&EX100.
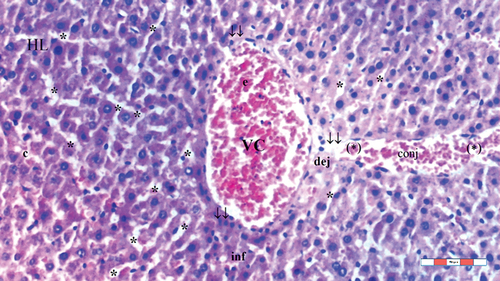
Figure 4. Light microscopic view of liver tissue of group IR-Sevo (HL: hepatic lobules; VC: vena centralis; *: sinusoid dilatation; ↓↓: infiltration; →: hepatocyte; k: kupffer cell hyperplasia; (*): necrotic and apoptotic appearance in hepatocytes), H&EX100.
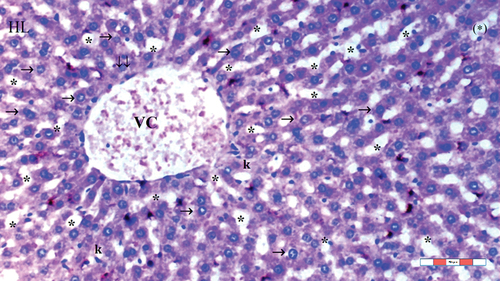
Figure 5. Light microscopic view of liver tissue of group IR-FC60 (HL: hepatic lobules; VC: vena centralis; con: congestion; *: sinusoid dilatation; ↓↓: infiltration; →: hepatocyte; c: dikaryotic hepatocytes; k: kupffer cell hyperplasia; dej: hydrophilic degeneration; con: congestion), H&EX100.
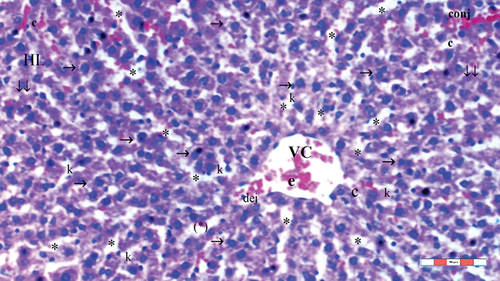
Figure 6. Light microscopic view of liver tissue of group IR-FC60-Sevo (HL: hepatic lobules; VC: vena centralis; e: erythrocyte; *: sinusoid dilatation; ↓↓: infiltration; →: hepatocyte; k: kupffer cell hyperplasia; (*): necrotic and apoptotic appearance in hepatocytes), H&EX100.
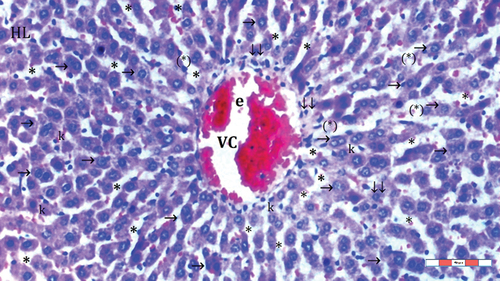
Figure 7. The comparison of histological changes in rat hepatic tissue [mean ± SD], *p <0.05: when compared with group IR.
![Figure 7. The comparison of histological changes in rat hepatic tissue [mean ± SD], *p <0.05: when compared with group IR.](/cms/asset/eb663a8e-dc7c-4528-8eab-1f1b606b02d7/zljm_a_2281116_f0007_oc.jpg)
Table 1. The comparison of histological changes in rat hepatic tissue [mean ± SD].
Table 2. Oxidative state parameters in rat hepatic tissue [mean ± SD].
Figure 8. Oxidative state parameters in rat hepatic tissue [mean ± SD], *p <0.05: when compared with group IR.
![Figure 8. Oxidative state parameters in rat hepatic tissue [mean ± SD], *p <0.05: when compared with group IR.](/cms/asset/40b7987d-fcfe-4d1e-87c3-5ec9782db9d8/zljm_a_2281116_f0008_oc.jpg)